

Stevanato Group (STVN) (Pt. 4)
Management & Incentives, Capital Allocation, and the Valuation

Hi reader,
Welcome to the fourth article of the Stevanato series. I’ll discuss three key topics for any company: management and how they are compensated, capital allocation, and valuation. If you have not read the first three articles, I recommend reading them before reading this one. You can ignore these links if you have already read them and are up to date with the series.
Stevanato’s stock has risen substantially since I published the first article (October 21st). I’m up around 15% from my cost basis in under a month, something I did not foresee and don’t like as I am still building my position. As you can see in the graph below, this is also not an unusual swing for the company due to its high volatility:

With no earnings surprises and no material change to forward expectations, this rise was purely caused by an expansion of the valuation multiple. I’ll discuss valuation from the point of view of the date I added it to the portfolio and based on where the company stands today.
When reading the Stevanato article series, one thing to consider is that it’s a newcomer to financial markets. The company IPOed in 2021, so publicly available information is limited, which I cited as one of the main risks. It is worth remembering this when sizing the position and reading the research.
Without further ado, let’s jump right into management.
Management & Incentives
Stevanato shines in management & incentives primarily for two reasons:
It’s founder-led, and there’s very high insider ownership
The compensation structure is based on two metrics with a proven track record of delivering superior shareholder returns (more on this later)
Stevanato has a relatively small management team comprised of 7 members.
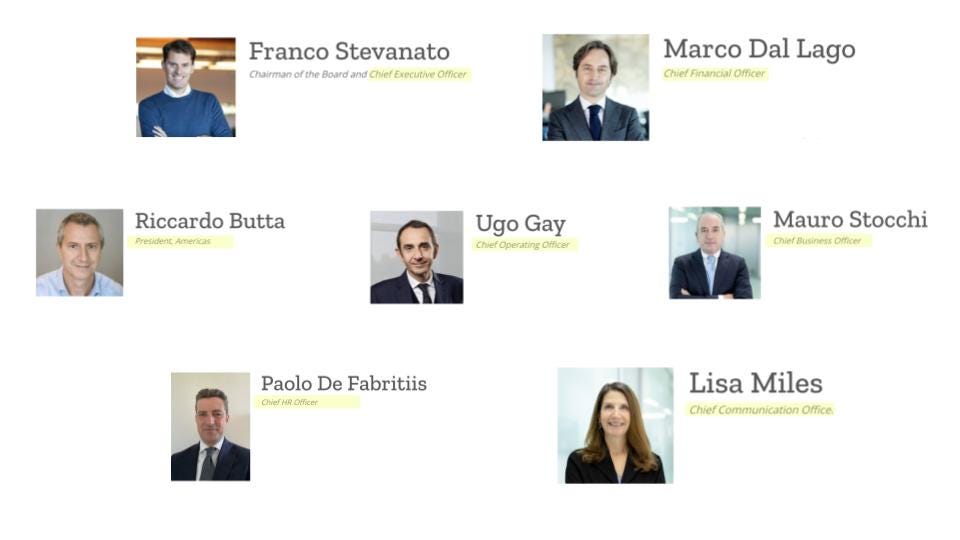
These executive members don’t have a significant tenure in the business on average. This could be considered somewhat normal because the needs of a management team for public markets might differ from those of a management team that runs a private company. Let me share several examples to explain what I mean.
First, the CFO, Marco Dal Lago, joined the company in 2020, probably as Stevanato prepared the IPO. The qualities needed to be a CFO of a privately traded company are different from those needed to be the CFO of a private company. Marco Dal Lago has experience as the CFO of a publicly traded company because he served as the Group CFO of Nidec ASI from 2013 to 2016. Nidec ASI was not directly publicly traded, but it became part of Nidec Corporation, a publicly traded Japanese company, in 2012.
Another example here is Lisa Miles. She joined Stevanato in 2021 as Chief Communications Officer and VP of Investor Relations. It basically did not make sense for this position even to exist before the IPO, so it’s normal to see low tenure here.
I would also highlight the position of Chief Operations Officer, held by Ugo Gay since 2024. The COO position was also newly created in 2024 due to the Engineering segment's problems. One could argue that Engineering might’ve needed a COO earlier, but it had never faced such a period of outsized growth and probably didn’t face the headwinds it does today. Ugo Gay was formerly the CEO of DiaSorin. The company is somewhat related to Stevanato and did not enjoy great performance during his tenure (2022 to 2024), but this was also a period through which healthcare companies, in general, have not done great.
Despite these nuances, the average management tenure at Stevanato is 8 years, heavily skewed toward Franco Stevanato, the CEO, and Mauro Stocchi, the Chief Business Officer. This tenure is nothing to write home about, but somewhat understandable considering how early the company is into its public market career:

Franco Stevanato (the founder’s grandson) was recently reappointed CEO after the IPO was said and done, but it’s not his first tenure. He had already served as CEO from 2010 to 2020.
For Stevanato, looking at the board of directors is also key because there are a couple of highlights. Franco Stevanato regularly claims that one of the objectives before going public was to build a strong board of directors that could guide the company, and he seems to have done just fine in this regard.
The board of directors is currently comprised of 12 members, most of which have extensive experience in Stevanato’s industry in companies like Amgen. I will not review all of the board members, but I believe there are 3 worth highlighting.
The first one is the Chair Emeritus, Sergio Stevanato.

Sergio Stevanato is Franco Stevanato’s (the current CEO) father. Much of what we see today at Stevanato is possible thanks to what he did while running the company for decades. I would say it’s great news to have him on the board, and it also makes sense to see him there, considering how much of his net worth is tied to the business.
The two other highlights are more important than it might look at first sight: Don Morel and William Federici. These directors served as CEO and CFO of West Pharmaceuticals for more than a decade. Don Morel was West’s CEO from 2002 to 2015, a period through which West’s stock significantly beat market averages:

William Federici was West’s CFO from 2003 to 2018, and I don’t think a graph is necessary to show that the company significantly beat the market during his tenure (the one you see above should do the trick). Having these tenured executives on the board is a great asset for Stevanato. Karen Flynn, another board member, was West's Chief Commercial Officer for several years. Out of 12 board members, 3 are former West Pharmaceuticals executives.
All in all, Stevanato has what appears to be a strong management team. I write “appears” because this management team, while good on paper, does not have a demonstrable track record of creating shareholder value at Stevanato. This is definitely a risk worth considering when sizing Stevanato's position in any portfolio.
Incentives: the best of both worlds
As the management team is still unproven, we should closely examine incentives to understand if these are geared to make managers think about the most favorable long-term outcomes. I must say Stevanato shines in terms of incentives for two reasons.
The first one is pretty straightforward: most of the family’s net worth is tied to the business. Recall that the Stevanato family still retains 82% of the outstanding shares through Stevanato Holding S.R.L:
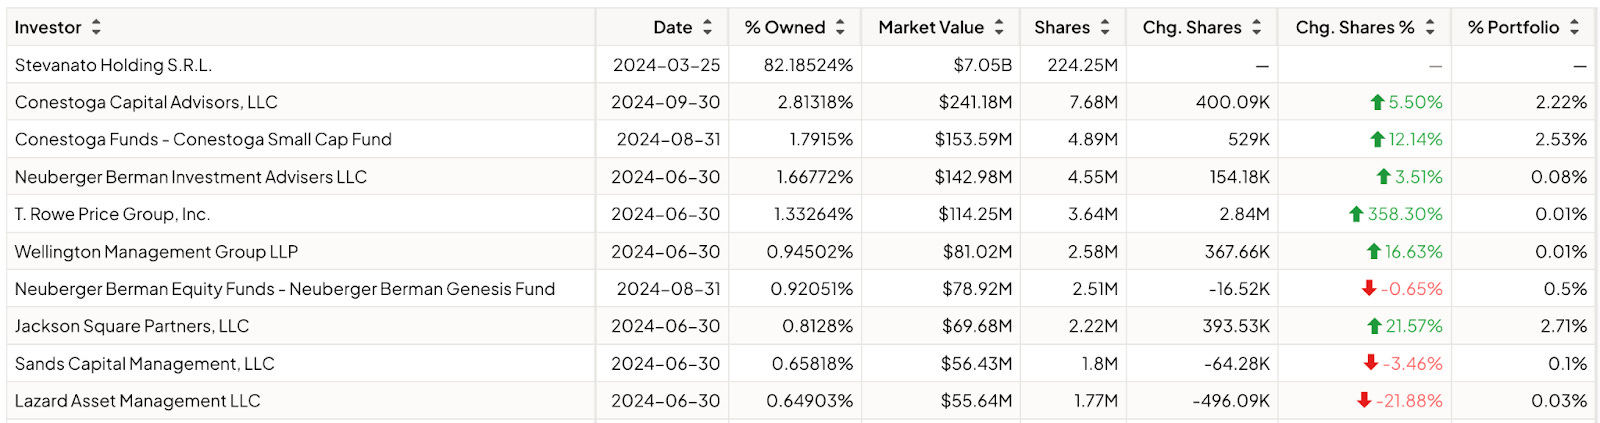
There’s no denying that the Stevanato family is strongly incentivized to see the share price rise. Note that doubling the share price would equate to far more value creation for the family than any given salary could pay. It is worth highlighting that the company has a dual-shareholder structure where the A shares (the shares the family owns) are entitled to 3 votes per share rather than the 1 vote per share the ordinary shares are entitled to.
While their significant ownership incentivizes the family to increase the share price, we should also analyze executive compensation. The reason is that Stevanato’s insider ownership is heavily skewed toward the family, but insider ownership is low across the rest of the managers. There is also good news in terms of compensation, although we can’t know to what extent because the publicly available information is limited.
There are several parts to the company’s compensation, but I’ll focus on the long-term incentive. The long-term incentive is paid in shares and based on revenue growth and ROIC over three years. This is a good combination because it covers profitable growth. The only problem here is that we don’t know the thresholds or targets for any of the metrics. This is what we can read in the 20F:
The performance target level, minimum target, overachievement target and maximum target of each performance criterion, for each vesting period, were communicated to the beneficiaries with the grant letter.
While this is not great, I have little reason to think why they would set a ROIC below the cost of capital, considering the family owns 80%+ of the shares and that such an objective would probably destroy quite a bit of value for them. What we do know about the compensation structure is the following:
It’s equally weighted between revenue growth and CAGR (50/50)
Managers make 0% if they are below target, 50% if they achieve the minimum target, 100% if they meet the target, and up to 200% if they exceed the target
It’s also interesting that it uncoincidentally mimics West Pharmaceutical’s compensation structure. West uses organic growth CAGR (rather than absolute revenue growth) and ROIC and does provide threshold, target, and maximum numbers, so it’s more transparent:
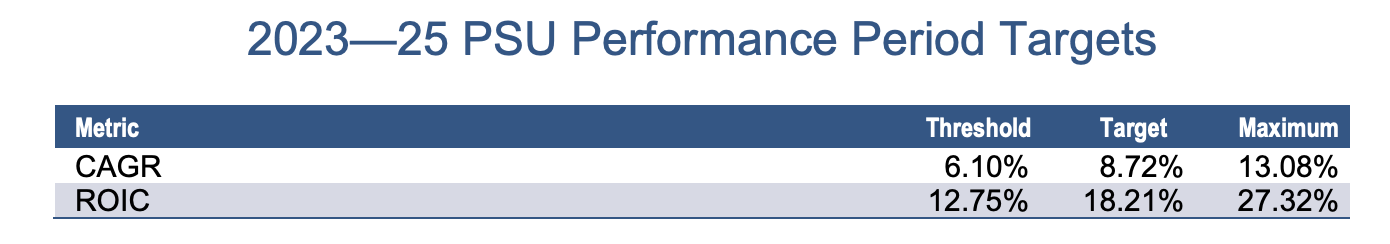
I had some trouble finding out when West implemented this compensation structure, but in the 2003 Proxy Statement, I read that the LTI was based on peer practices, so there were no metrics as such backing up the long-term incentive. This means that the organic growth CAGR and ROIC duopoly was most likely established when Don Morel and William Federici were serving at West. It’s not strange, under that scenario, to see a similar compensation structure applied here.
Unlike West's focus on organic growth, Stevanato’s compensation structure is based on total revenue growth. This would be worrying in many cases because it might incentivize a “growth at all costs” mentality, but I don’t think this is the case here because ROIC is precisely there to control for that.
All in all, I don’t think we should be worried about how aligned management’s incentives are. The compensation metrics make sense despite lacking transparency. This lack of transparency would be worrying in many cases, but I don’t think it is in this case because the Stevanato family has a pretty large incentive to see the stock do well over the long term. Any wound they inflict on individual shareholders would be a wound they would suffer 5 times as much. All this said, we should not forget there’s a risk of the family taking the company private at some point in the future. This would definitely be a blow for individual shareholders and not themselves.
Capital Allocation
At the beginning of the article, I wrote the following:
When reading the Stevanato article series, one thing to consider is that it’s a newcomer to financial markets. The company IPOed in 2021, so publicly available information is limited, which I cited as one of the main risks.
This is very applicable to this section. Capital allocation should be judged over a long enough period, but we don’t have that luxury here. Current return metrics (ROE, ROIC…) look terrible because Stevanato is going through a significant capacity expansion plan while it suffers significant profitability and growth headwinds.
Before jumping into returns, let’s understand where Stevanato invests its money. The company reinvests into the business through two primary vehicles: the income statement and the cash flow statement.
In the income statement, most of the reinvestment occurs through Research and Development, which is crucial to advancing high-value solutions. Thanks to its scale and the high entry barriers in the industry, Stevanato does not need to spend large sums on R&D, around 3% to 4% of sales. This is consistent with what other companies in the industry spend, albeit higher (note that companies are not entirely comparable and some, like West, are considerably larger than Stevanato and therefore invest more in absolute terms):

It’s through the cash flow statement that the big dollars are currently being reinvested. Stevanato IPOed in 2021 with the sole objective of using the proceeds to fuel a capacity expansion plan. This has led to hundreds of millions being reinvested in capacity over the past few years, with Capex as a percentage of sales going as high as 40%. According to management, this is a business with maintenance Capex around 3%, so most of this Capex was growth Capex:

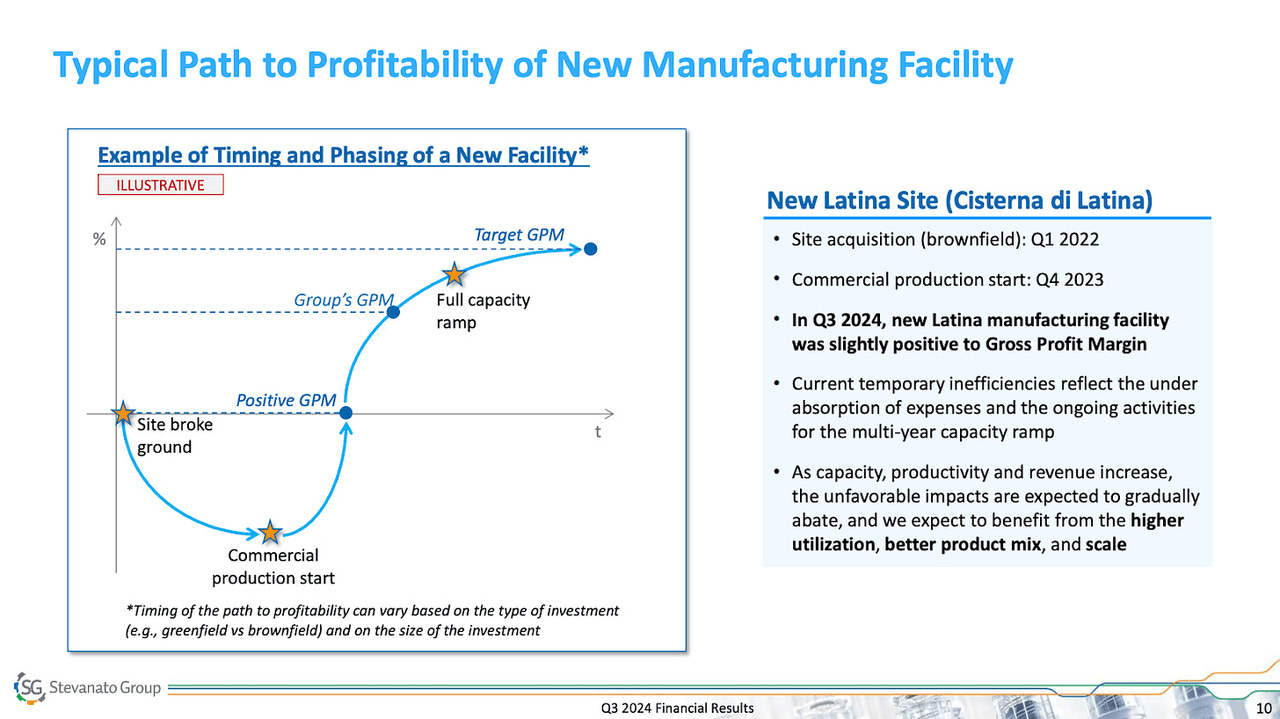
Now, where is this Capex being reinvested specifically? In two manufacturing facilities: Latina and Fishers. Both are greenfield investments, but the Latina facility less so as it’s located a few kilometers away from an already existing Stevanato plant.

Latina generated its first commercial revenue in Q4 2023 and reached gross margin profitability just last quarter (Q3 2024), so it’s far from full capacity ramp-up.
The most significant investment, however, is going into Fishers, Stevanato’s brand-new facility in Indiana (United States). The company expects to invest around €500 million into this facility, but this is a gross amount and needs to be adjusted by the BARDA payments to get to the net figure. BARDA stands for “Biomedical Advanced Research and Development Authority” and incentivizes companies to build manufacturing capacity in the US. In Stevanato’s case, this will equal around €95 million, so the net investment into Fishers is closer to €400 million than €500 million.
Fishers is behind Latina in terms of ramp-up and produced its first commercial revenue last quarter (Q3 2024) while still being far from gross margin breakeven. Assuming a similar ramp-up to Latina, we should expect this facility to be gross margin breakeven sometime in the middle of next year. Note that management mentioned in the Q3 earnings call that both Fishers and Latina combined are in negative gross margin territory. So it’s not like they are under the company's gross margin but in positive territory; they are in negative territory. Expectations are for the gross margin to eventually be higher than the company average due to their focus on high-value solutions:
Stevanato has not generated enough Operating Cash Flow to fund these investments, so the capital has come primarily from three sources:
Capital proceeds from the IPO + subsequent share issues
Debt issuance
BARDA
These three have allowed Stevanato to undertake its capacity expansion plan, and there is some good news. First, the company still runs with very low leverage, under 1x “depressed” EBITDA. Secondly, it seems like the company will not need much additional capital as Capex is now normalizing, profitability is expected to improve, and the business still has €80 million in cash.
Now, the company’s yet inefficient capacity, together with the destocking issue and the operating problems in the engineering segment have caused returns to decrease dramatically since IPO. ROIC and ROE were decent when the company IPOed in 2021, but these metrics are now probably below or close to the company’s cost of capital:

I obviously don’t think these are normalized returns, but they are what they are. The reason has been a significant decrease in profitability coupled with a significantly higher invested capital base (a double whammy for ROIC):

As I mentioned in the article about the financials and growth drivers, there are reasons to be optimistic regarding the current capacity expansion plans and the returns it might bring. As you might have imagined, a good chunk of the investment thesis in Stevanato relies on these capital investments bearing fruit over the medium to long term.
Management targets €1 of revenue per €1 invested into Capex, and we should not forget this revenue will be above average in terms of profitability because it will come from high-value solutions. This means that, based on what the company has invested over the last 5 years and how much it has grown, there’s still a significant untapped growth opportunity.
I made some rough calculations in the table below. Stevanato has generated incremental sales of €548 million over the last 5 years while investing €1.25 billion in Capex. If management’s relationship between sales and Capex holds, this means that there are still around €700 million in unrealized sales for the company just based on the investments in capacity to date (i.e., not considering the Capex management will continue to spend going forward):

This is just an approximation and should not be taken at heart. Still, it shows how much revenue growth there is embedded just considering the capacity investments already made.
All in all, Stevanato’s capital allocation is tough to analyze to date because there’s limited publicly available information. Current returns don’t seem good at all, but that’s a consequence of profitability headwinds coinciding with the company’s largest capacity expansion ever (both are somewhat related, albeit not completely).
The Valuation
I discussed this topic briefly in the first article, but we could consider that to be already outdated since Stevanato’s stock has moved a fair bit since then. In that article, I used multiples to discuss valuation, which I’ll also do in this one. We could use an inverse DCF to value Stevanato, but the main roadblock is the current negative free cash flow caused by the significant capacity expansion plan. I believe multiples are more appropriate, but I’ll also discuss cash flows.
After the recent run, Stevanato is currently trading at a TTM and forward EV/EBITDA multiple of 21x and 17x, respectively:

Multiples increase markedly as we make our way down the income statement. For example, EBIT has decreased faster than EBITDA due to the drop in the latter and higher Depreciation and amortization (D&A). D&A has grown considerably due to the recent capacity expansion plan.
Several things discussed during the article series (slow ramp-up, destocking, engineering problems…) have caused an increase of D&A significantly ahead of revenue. Since 2021 (the date when the capacity expansion started), revenue has grown at a 9% CAGR, whereas D&A has grown at a 17% CAGR:

This is responsible for a significant gap between EBITDA and EBIT. Operating Income (an EBIT proxy) is down 17% over the past 12 months, whereas EBITDA is down 14%. Operating income has grown at a 0.5% CAGR since 2021, whereas EBITDA has CAGRd at a 3% rate.
Stevanato’s forward EV/EBIT multiple currently stands at 28x:

These two charts portray an interesting market dynamic and demonstrate that it tends to be pro-cyclical. Stevanato reached EBITDA and Operating Income highs in 2023. Growth and margins were good back then, so the market granted the company a high multiple on these earnings. This led the stock to trade at an all-time high of $34-$35. The market is filled with recency bias, so it tends to extrapolate recent events to the future: what’s good will continue to be good, and what’s bad will continue to be bad.
But then, Stevanato’s myriad of headwinds started to impact the numbers. Not only did Stevanato’s profits fall, but so did its multiple. This was a double whammy for the stock price, which got cut in half in a very short period:

We might have some kind of the opposite scenario today: Stevanato is trading at a below-average multiple (compared to its short history and West Pharmaceuticals), but it’s doing so on depressed EBITDA. The two tailwinds (high earnings and a high valuation) the company enjoyed in 2023 turned out to be headwinds in 2024.
I advise against counting on multiple expansion to make the investment thesis “work.” It’s growth in fundamentals that should make this a good investment. Still, there’s no denying the stock potentially has the two return engines at its disposal: earnings growth and multiple expansion.
Let’s focus on what EBITDA and operating income can do going forward. Forecasting is honestly a “fools” game. Still, it’s much better to try to forecast (while being conservative) something that we can control rather than what the mood of thousands of market participants will be three years down the road. The goal here is not to be precise with our forecast but rather to determine if Stevanato is a good risk/reward opportunity.
We should also consider that analysts tend to be pretty optimistic with their estimates (on average). This means we should take them with a grain of salt, although I am inclined to think they tend to be more optimistic when things are going well (not the case for Stevanato).
Analysts estimate that Stevanato will generate €256 million of operating income in 2026. This would equate to a 22% two-year CAGR.

This expected growth in operating income comes from several sources. First, a recovery in revenue growth. Secondly, and most importantly, analysts' expectations of significant margin expansion.
Analysts expect the operating margin to expand from 15.8% in 2024 to 19.5% in 2026. This seems doable considering that it’s not even peak operating margins (achieved in 2022 at 19.6%) and the fact that high-value solutions will make a more significant proportion of total revenue in 2026 than they did in 2022.
If Stevanato manages to meet these expectations (which, as I will talk about in a bit are slightly below management’s), we should theoretically end up with a handsome double-digit return assuming no multiple expansion or contraction. Multiples could definitely contract from here, but it’s tough to envision such a scenario through a period in which the company is growing double digits and expanding margins.
Understanding management’s medium-term guidance
Management shared some medium-term guidance going up to 2027 when the company IPOed. The main components of this “guidance” were the following:
Low double-digit growth
Adjusted EBITDA margin of at least 30% by 2027
FCF/Adjusted EBITDA conversion of 40% in 2027 (midpoint)
Let’s start with the first component: low-double-digit growth. The expectations of low double-digit growth were shared before the company grew significantly above this rate during the pandemic period. Coincidentally enough, a 10% CAGR on 2021 revenues lands us in a very similar revenue to the one expected in 2024: €1.10 billion. Despite the ups and downs, management’s expectations of a 10% CAGR in revenue growth stood true, and despite the unknown pace of the recovery, I am assuming it stands true going forward. This lands us at around revenue of €1.5 billion in 2027 (analysts expect €1.32 billion for 2026, slightly below what this model suggests).

To this, we have to add the second component of management’s guidance: adjusted EBITDA margin expectations of 30% by 2027. I must say that with Latina and Fishers ramping up and the expectations of the destocking issue ending in 2025, plus the higher proportion of HVS and expectations of a profitability recovery in engineering, I view this as conservative despite the significant margin expansion required to get to this number. Revenue growth added to this margin expansion makes adjusted EBITDA (supposedly) land at €450 million in 2027. This results in an Adjusted EBITDA CAGR of 20% from 2024 to 2027:

Adjusted EBITDA converted at a 140% rate (on average) to operating income in years leading to the significant capacity expansion plan. If this conversion rate remains true in 2027, it means that analysts are implicitly expecting around €360 million in Adjusted EBITDA in 2026, which is only 5% below management’s implied expectations of €380 million.
Considering management’s guide regarding FCF/Adjusted EBITDA conversion, Stevanato should end up with roughly €180 million in Free Cash Flow in 2027. That would put the company trading at a 2027 FCF yield of 3%. This FCF yield would be consistent with the company spending enough Capex to sustain double-digit growth going forward.
Management has claimed that Capex could go as low as 3% if the company would not need to invest for growth. Under that scenario, the company is currently trading at a 2027 5% FCF yield, which is undoubtedly better but would only support around 3% growth going forward.
I believe management is pretty conservative here, and something doesn’t add up. Recall that I mentioned before that they expect €1 euro of Capex to result in 1€ of revenue, and we found out that the current differential between incremental sales and Capex euros spent is around €700 million. This would mean that the current capacity expansion plan can support up to €1.7 billion in sales. This has two potential implications:
Management is being conservative with their growth expectations (i.e., they’ll grow faster)
Management is being conservative with the required Capex going forward (i.e., they’ll need less Capex to sustain growth)
The third option is that (a) they are being misleading, or (b) I misunderstood something. Option (b) is unlikely here, as management confirmed to me that I am not misunderstanding anything:
It is one euro of capex will generate one euro of revenue – when the production is at full capacity. So for example in Fishers, we expect to invest roughly 500M. The site will achieve full productivity in mid to late 2028 approximately. In this case, we would anticipate hitting the 500M in revenue in that 2028 time frame.
I still have some doubts about this, so I’ll keep you posted to what I find out.
A summary and my purchase price (included in the decision spreadsheet)
Stevanato seems to be reasonably valued here on conservative estimates. If we were to do quick napkin math from today’s price, we would see that the risk-return seems favorably skewed here. Let’s build to scenarios: base and bear.
Stevanato is currently trading at an EV/EBIT of 34x on depressed EBIT. EBIT is expected to grow at a 23% CAGR over the next three years, which should approximate our return IF (big if) the multiple stays constant. Stevanato’s EV/EBIT multiple has averaged 32x since going public (albeit not a long track record). If we were to look at West Pharma’s EV/EBIT multiple, although not entirely comparable to Stevanato, we would see a 10-year average of 34x:

It would be more conservative to assume that Stevanato’s EBIT multiple in 2027 contracts to 25x. Under this scenario, our total return CAGR from the current price would be 11% (assuming the fundamentals stand, of course).
This seems like an acceptable return, considering we are assuming a 30% contraction in the multiple. I struggle to see how the company would trade at a 27% lower multiple while improving margins and growing faster, but anything can happen in financial markets.

Also worth noting that my purchase price of Stevanato implies an EBIT multiple of around 28x-30x. This evidently results in a higher expected return CAGR under these same assumptions of around 16% to 17%.
Let’s look at the bear scenario where the multiple contracts to 25% and Operating Income grows at a 15% CAGR rather than the aforementioned 23%. Recall this growth comes from depressed levels. Under this scenario, our total return CAGR would be around 4% from today’s levels. This is obviously unsatisfactory, but we are being pretty conservative both in the profit number as well as in how the market values those profits:

From my cost basis total return CAGR would be around 9% in this scenario.
I call this the “bear case” to portray it’s a pessimistic case, but the worst case always is losing money on an investment. A 25x EBIT multiple is undoubtedly a rich multiple no matter the company one is looking at, but it should be understood in the context of the company’s quality. At a 25x EBIT multiple, Stevanato would most likely be trading at a P/E of around high 20s or low 30s, which is acceptable considering its quality compared to the average company in the S&P 500 and the fact that the S&P 500 is trading at 22x forward. What I wanted to portray above is that Stevanato seems like a good opportunity in terms of risk/reward, but losing money, as in any investment, is definitely possible. If losing money were not possible then all returns would be riskless, and there would be no need to diversify.
I believe Stevanato is a good buy here, so I will continue adding to my position at around $20 or lower. Sizing is also an important consideration because it’s a company with a short track record in public markets and it’s new to my portfolio, so I have to be careful not sizing it up too much.
In the meantime, keep growing!
Read part 5 here 👇🏻
A High-Quality Family Business Swamped in Opportunity Cost (Pt. 5)

Before jumping into this article I wanted to remind you that I am currently running a poll in the chatroom to see where you prefer that I start the Best Anchor Stocks community. If you have not joine…
The BARDA program is on the Trump/DOGE/JFK list of things to "review". Stevanato uses very little leverage, so they should survive any disruptions here, but it does seem like the Indiana project is in danger.
Cheers! And this is a very high-quality writeup.
Great write-up!
I have a question out of curiosity.
What made you opt for EBIT (and not EBITDA) for multiples?
With so much Capex, there will surely be lots of DA in the next years.