


Best Anchor Stocks has a partnership with Fiscal.ai (the research platform I personally use), through which you can enjoy a 15% discount on any plan. Use this link to claim yours! You’ll find KPIs, Copilot (a ChatGPT focused on finance) and the best UX:

You can read this article (almost) entirely for free. If you like what you read, consider becoming a paid member to get access to…
All in-depth reports (15 companies profiled thus far, and growing)
Earnings follow-ups
Other investment related content
A community of like-minded investors
Complete access to my portfolio and transactions
Occasional webinars
You’ll also get access to the 30+ page detailed report on the robotics industry.
The in-depth reports of Stevanato and Deere are also free to read to gauge the quality of the research.
Join today:
The momentum factor has been suffering quite a violent reversal over the past few weeks, will it be secular? I talk about this and more things in the market commentary.
Without further ado, let’s get on with it.
The new in-depth report (aka. my new position)
This week I published my new in-depth report.
(NEW REPORT) Proprietary monopolistic data that matters

Over the years, five names have shown up in Best Anchor Stocks that had one thing in common: cyclicality taking hold of the narrative despite the business’ long-term secularity.
The company I profile is a very interesting (and unknown) business that has a 90% market share on a mission-critical workflow in a trillion-dollar industry. I believe it’s poised to deliver an 18-19% CAGR over the next 5 years and I explain why in the report.
Paid subscribers can read all the in-depth reports here and the last 7 by clicking any of the links below:
Proprietary monopolistic data that matters (the new in-depth report)
The Durable Winners of the Robot Age (Robotics Industry primer)
Trupanion (TRUP): Applying the Amazon model in the Pet Insurance Industry
All of these in-depth reports contain a great amount of detail on the businesses and their investment theses (when applicable, as not all end up making it into the portfolio). Not in-depth reports per se (at least to my standards), but I’ve also published work lately on Rosebank Industries (LON:ROSE) and Sabre (SABR).
Articles of the week
Besides the in-depth report shared above, I also published a comprehensive article on the earnings of ASML/TSMC and the implications for the AI industry and ASML’s own 2030 guide.
The Bottleneck is Dying. Long Live The Bottleneck.

ASML and TSMC (two of the most relevant indicators of the health of the AI trade) reported earnings this week. I typically only write about ASML, but as I always end up reading TSMC’s call, I thought…
It’s a pretty in-depth article that should help you contextualize the recent capacity additions announced by ASML and what it means for its financials and the “bottleneck” investment thesis so prevalent in the AI sector.
Without further ado, let’s see what the markets did this week.
Market Overview
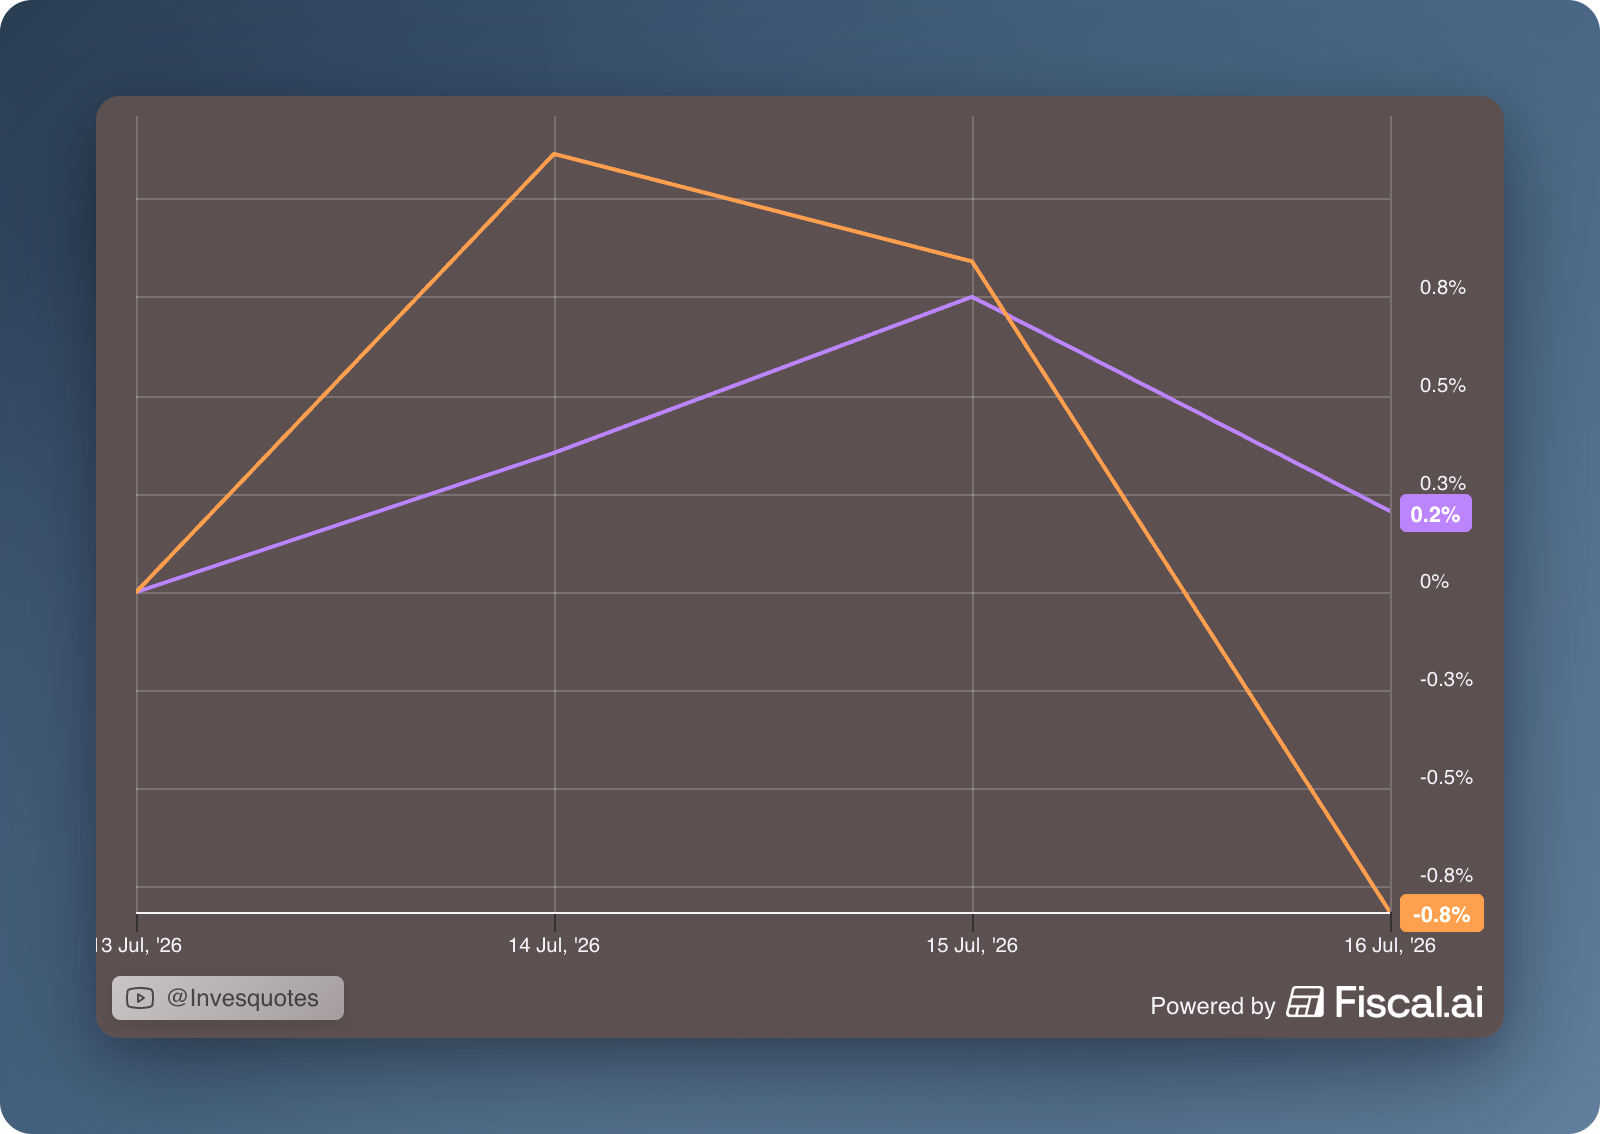
The S&P 500 was up 0.2% this week, whereas the Nasdaq was down 0.8%:
The past couple of weeks could be thought of as the “death of momentum,” albeit we don’t know how long this will last. The fact that “momentum” stocks have been doing poorly is pretty evident when comparing the performance of the SPMO (the S&P 500 momentum ETF) against that of the S&P 500. The former is down 10% over the last month, whereas the latter is basically flat and even slightly positive:
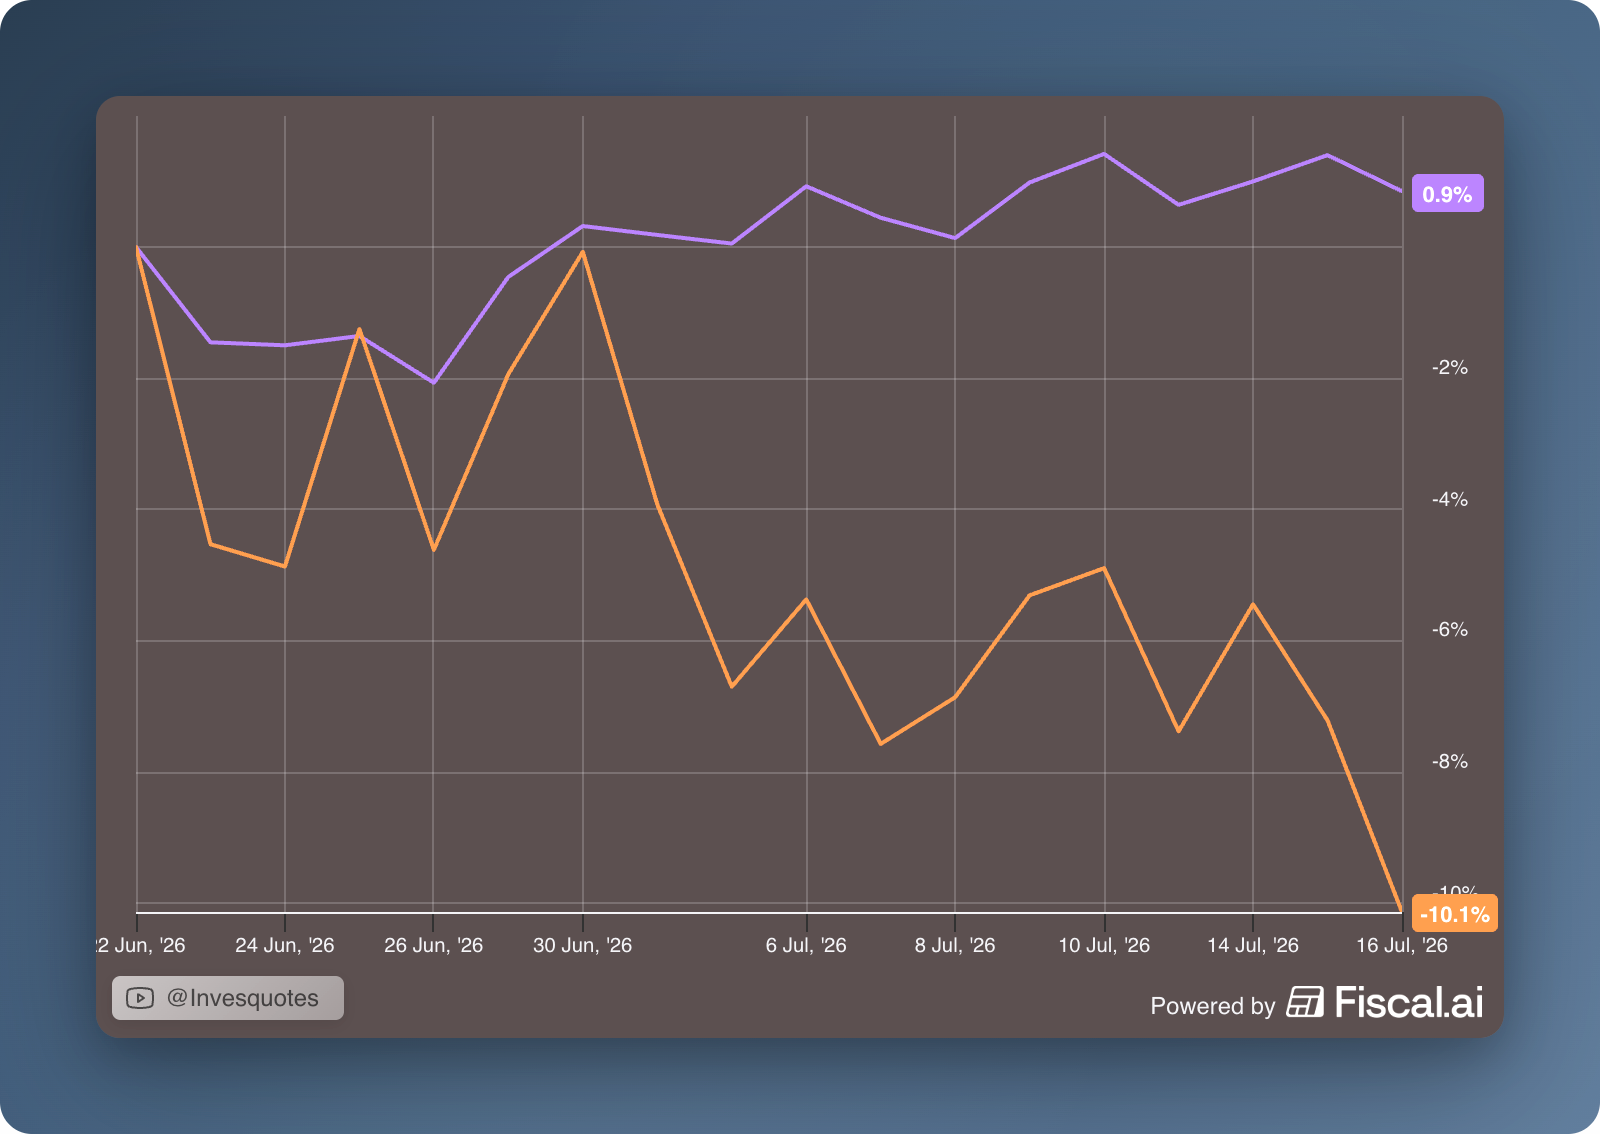
This means (in plain english) that those stocks enjoying the highest momentum score (i.e., those stocks whose stock prices had been going up significantly over the last 12 months) have been performing poorly as of late. When one combines this with the fact that many “investors” turned complacent and were running with high leverage…one gets to very significant (sometimes even unbelievable) drawdowns in a short period of time. I mean, what we’ve been seeing on X this week has been absolutely mind-boggling. Some people are down >40% in under a month with indices barely off from ATHs. I believe this is a consequence of two things (it always is): leverage and high concentration. This is precisely what one expects to see in a bull market. Fyi, one can be very concentrated even owning 20 stocks!
Even though (and to be fair) many of these people have displayed excellent returns over the past couple of months, they are now getting very emotional and believe that the market is extremely irrational. What they do not stop to think is that the market might have been extremely irrational in bidding up certain “bottleneck” and “chokepoint” AI companies. This is a tale as old as time: the market is only irrational when it goes against you!
Nobody knows what will happen with momentum from here on out, but momentum is indeed a factor that has been working for a long time. So much so that it led famous investor Terry Smith to shift his fund (Fundsmith) to a more “momentum-based” approach after losing considerable AUM after years of subpar performance. Did he call the top in momentum? Momentum has seen a pretty dramatic reversal since Terry shifted his strategy. I will say that this might be just a bump along the momentum factor’s way, but it’s important to understand that no matter how good and sustainable momentum has been in the past, it doesn’t mean that it’ll be the same way in the future. Reading about the story of Long Term Capital Management should make clear why!
The thing is that when one runs with extreme leverage, even a bump along the way can have disastrous consequences. This is why portfolio management is a topic that more people should give the importance it deserves. Trying to get rich very quickly in the stock market might end up with a blown-up portfolio. The reason is that maximizing returns is not useful if one is not accounting for risk. In short: any investor should strive to maximize risk-adjusted return.
There’s a very useful exercise (albeit subjective) that can help you with this. I have created a matrix (available to paid subscribers) comparing risk and expected IRR for the positions in my portfolio (i.e., the Best Anchor Stocks portfolio). The goal is to maximize the bottom-right quadrant (the best risk-adjusted returns) and minimize the top-left quadrant (the worst risk adjusted returns):
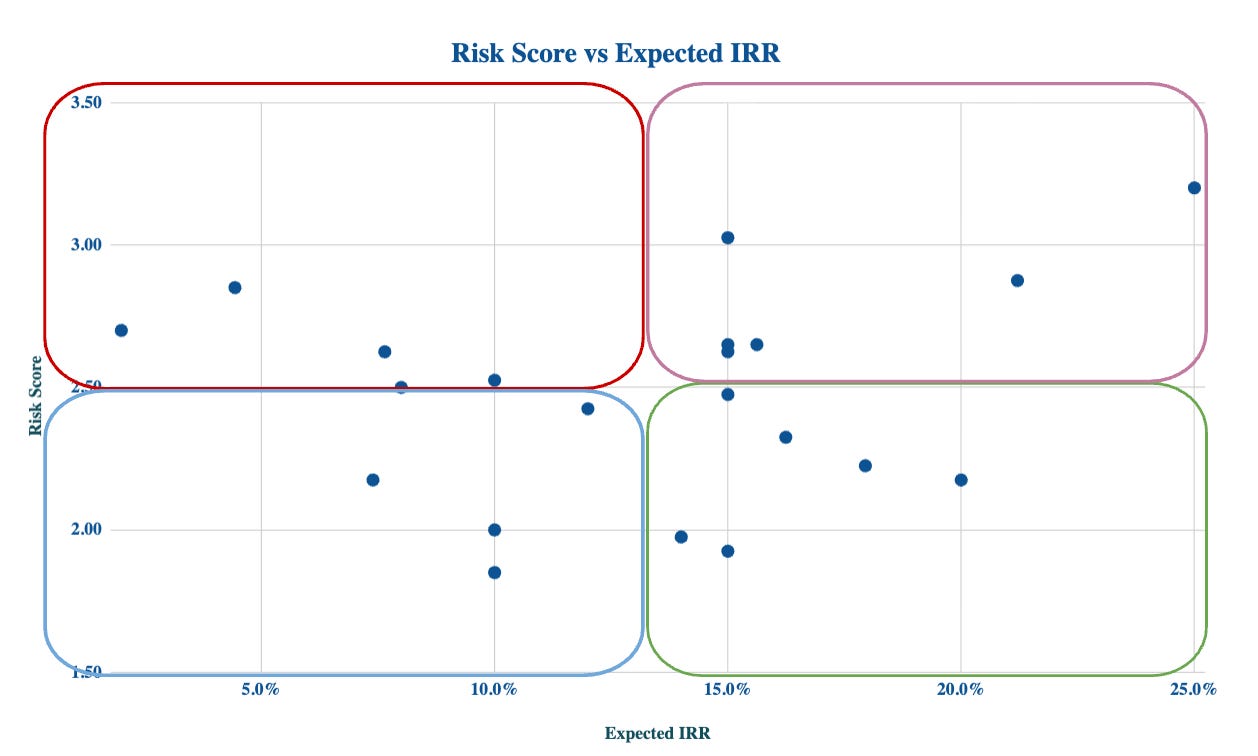
Despite the fact that indices are close to ATHs, my portfolio currently has a 46% exposure to the “Best” (bottom right) quadrant:

We’ll see how this ends up playing out over the long term, but I have high conviction that my top positions offer great risk-adjusted IRRs!
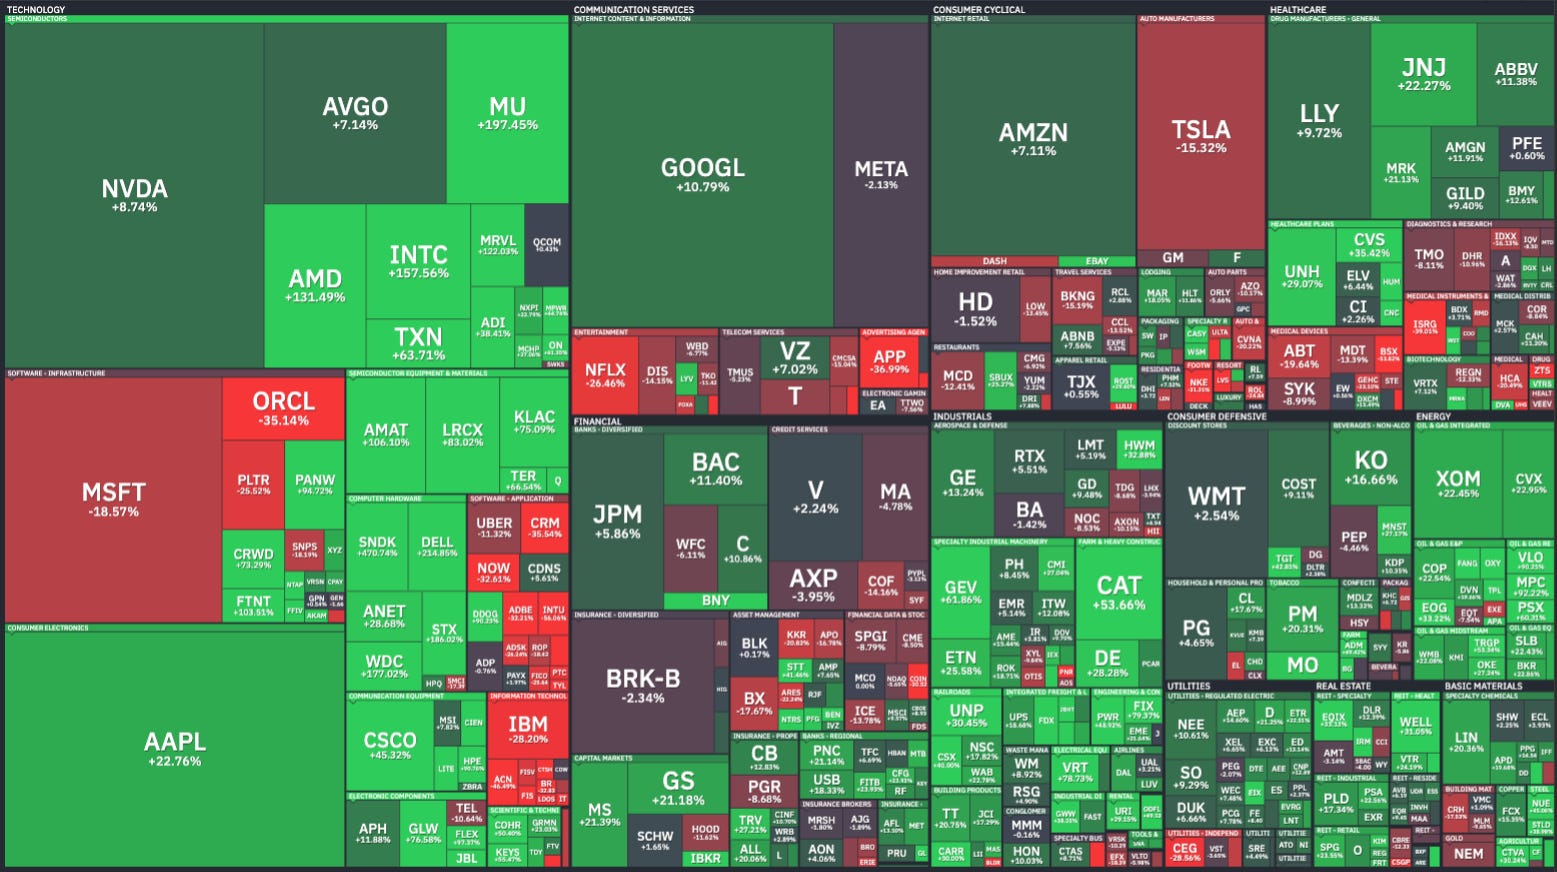
The industry map was a reflection of what I discussed above: many things that had been doing very well over the past couple of months ended up doing pretty poorly this week:
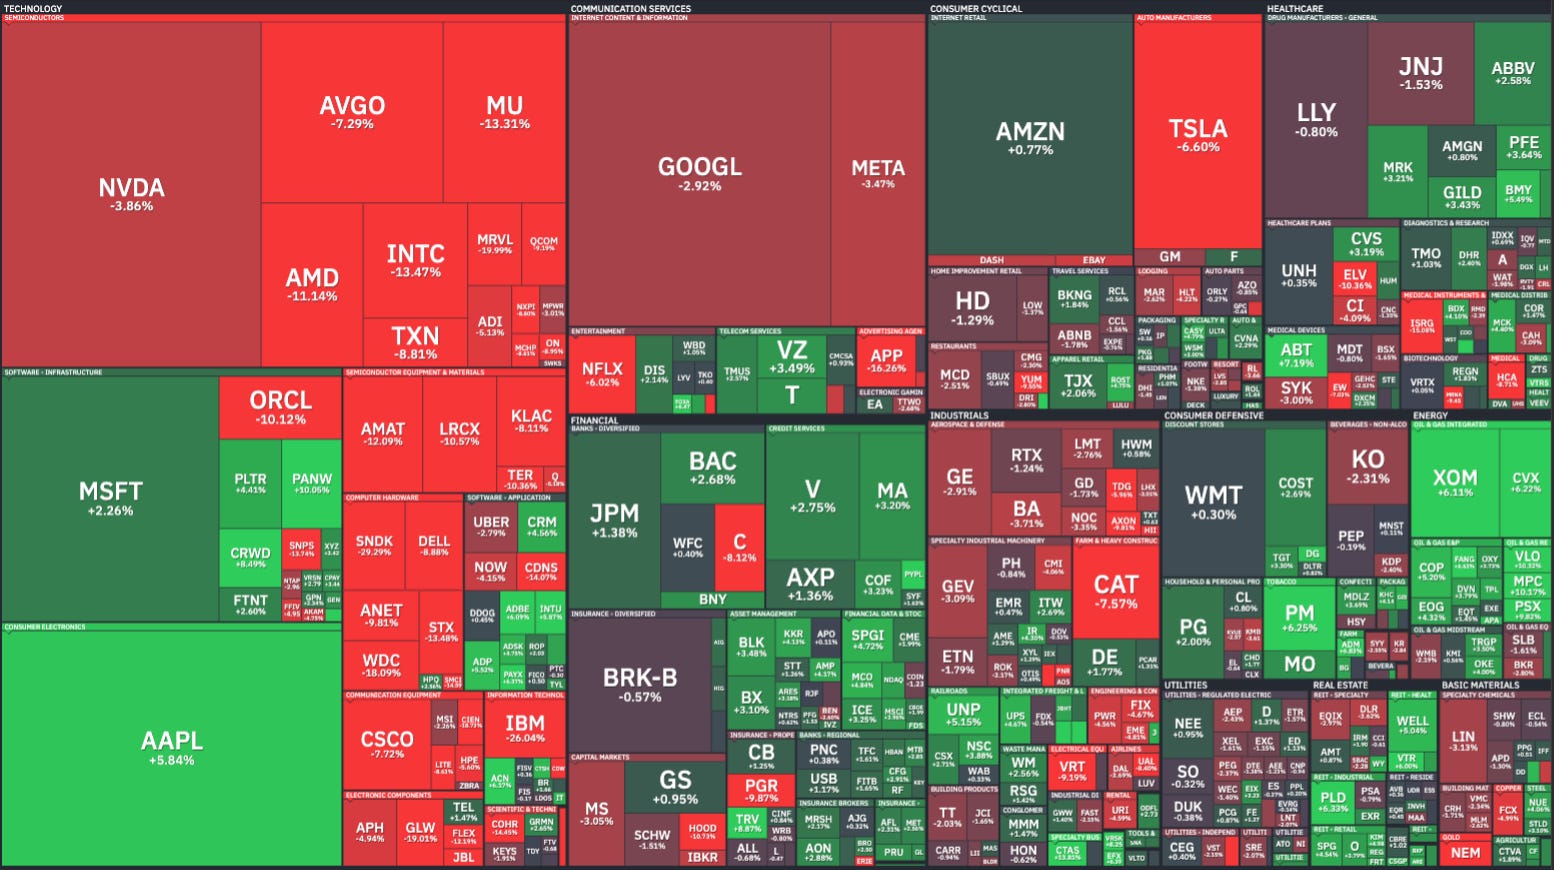
Source: Finviz
If you need any proof of this, take a look at how the above (which is a weekly performance) compares to the YTD performance:
The fear and greed index dropped to fear territory:
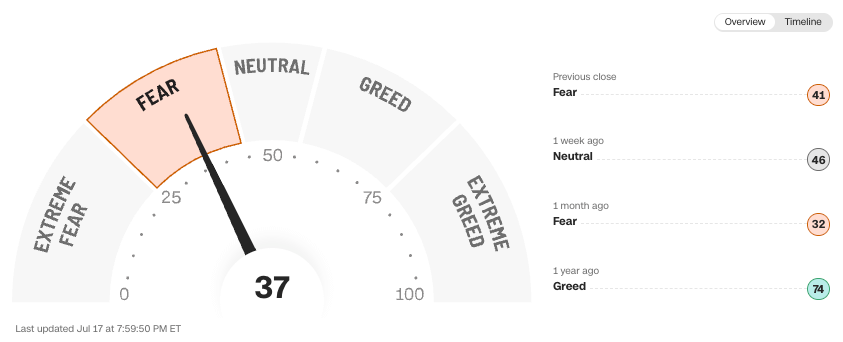
Source: CNN