

Performance
Hi reader,
I have decided to share the performance of the Best Anchor Stock portfolio. This is my personal portfolio and the one for which I share research and all related articles here. Note that I also write from time to time about companies that are not in the portfolio or about other investment-related topics.
If you want to join Best Anchor Stocks to have access to all the research, you can do it now:
The idea is to update all the graphs you’ll see here rather recurrently. I will update the performance every month.
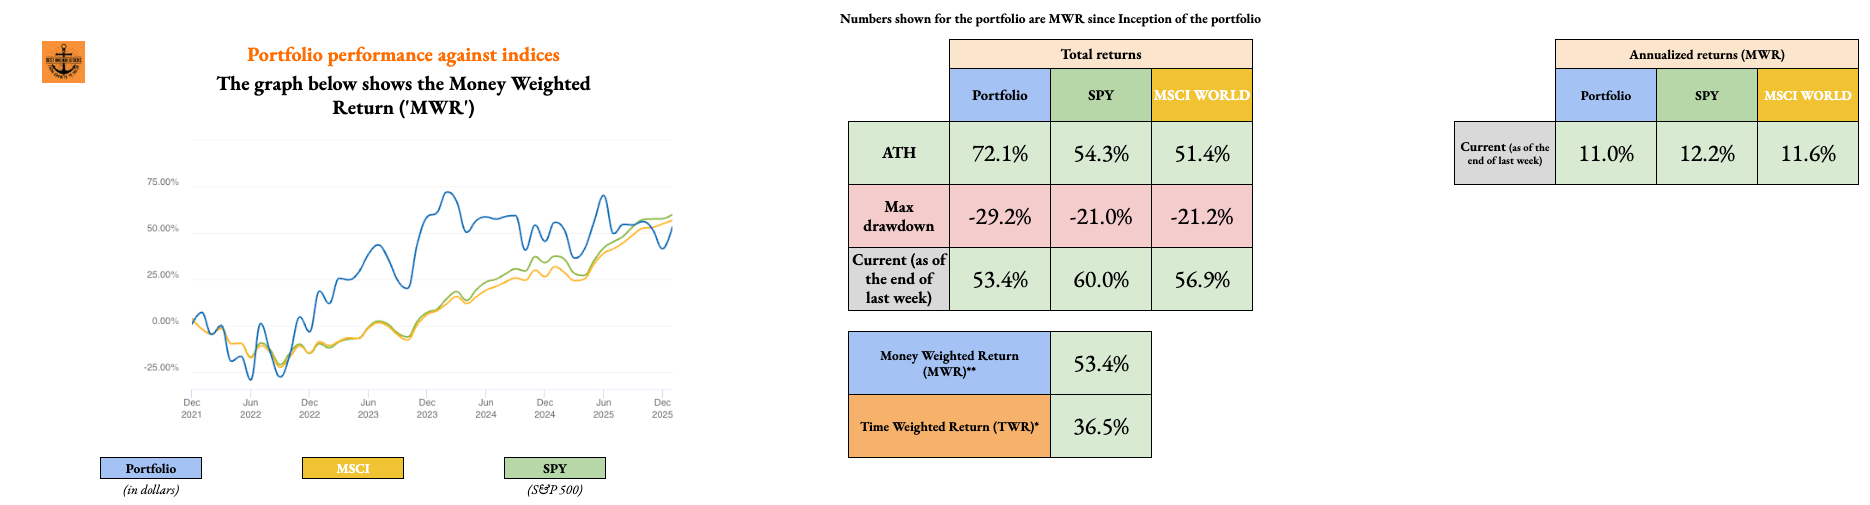
A few comments about the performance of the portfolio…
I will only share the return since inception as I believe this is the only return that matters, even if many investors have become used to sharing YTD (Year to Date) or QTD (Quarter to Date) returns. I feel that sharing such returns can be a tad misleading when one wants to look at the “true” return. The compounding effect ultimately means that our past returns play an important role in determining our overall return.
The inception date of the portfolio is the 14th of January 2022, so the investment horizon is still not long enough to judge performance. I mean, performance has been great (at least for my standards) but it’s impossible to know the role luck and skill have played in attaining these results. I believe a valid investment horizon starts at the fifth year mark (probably longer) as it’s the fundamentals that should take hold by then.
I’ll leave the graphs below.
Performance of the Best Anchor Stock portfolio
Last updated: 01/07/2025
Below you can find the MWR (Money Weighted Return) of the Best Anchor Stock portfolio since inception and how it compares against the main US indices:
This is all,
Have a great day,
Leandro