

A Tale as Old as Time (NOTW#42)

Best Anchor Stocks has a partnership with Finchat (the research platform I personally use), through which you can enjoy a 15% discount on any plan. Use this link to claim yours! You’ll find KPIs, Copilot (a ChatGPT focused on finance) and the best UX:

The indices were up again this week and breached levels many thought unthinkable barely a month ago. This might indicate one of two things, or probably both (two famous investing cliches):
Markets can climb a wall of worry (discussed in my last NOTW)
Price drives sentiment (discussed in this NOTW)
I also talk about the two universal truths you’ll face if you follow the investing world on X.
Without further ado, let’s get on with it.
Articles of the week
I published one article this week: Amazon’s earnings digest. The article's title (the narrative vs. the reality) was pretty representative of the quarter the company reported. Amazon has recently faced two narratives that have put downward pressure on the stock: tariffs and a potential AI bubble. The question here is…was it warranted? I discuss both topics in the article.
The Narrative vs. The Reality

Many long-term investors claim that not many things change in a quarter and that businesses and the environment tend to change over extended periods. While I consider myself one of these long-term investors, there’s no denying that
Next week, I will publish my Medpace report.

It’s a pretty comprehensive (+12,000 words) report going over the following topics…
The development of outsourcing in the pharma industry
The CRO industry
Why Medpace is unique
Financials and growth drivers
Competition, moat, and risks
Management, capital allocation, and valuation
I hope you enjoy reading as much as I enjoyed writing it. The first two sections will be open to read. You can subscribe to receive it in your inbox below:
Market Overview
It’s going to sound kind of unbelievable, but both indices were up again substantially this week. The Nasdaq rose more than 3%, whereas the S&P 500 rose more than 2%:

What’s interesting about this week’s move is that it took out “Liberation Day” highs. Liberation Day (when Trump announced the now-famous retaliatory tariffs) occurred on April 2nd. Markets reacted poorly to that announcement and had been down significantly since, but they managed to climb the wall of worry once again:

Nobody knows if this is simply a rally within a bear market or the market believing that the end-state of Liberation Day will be positive for US companies. What seems clear is that earnings season is surprising even the most optimistic. Q1 was definitely locked in before Liberation Day, and with all eyes on Q2 guidance, this is doing just fine (even for Amazon, which was theoretically going to be tremendously impacted by all of this). We can’t claim victory as we are still early into earnings season, but there seem to be no signs (at least from the hyperscalers) of reduced investments due to all the tariff tantrums. Hyperscalers have all announced increased Capex to build data centers, but semiconductor companies are still significantly off their highs. This seems somewhat puzzling to me, but the market might still think AI is a bubble:

I was also surprised that several industrial companies claim that the impact of tariffs has not been high thus far. This is not something I would’ve guessed when Liberation Day happened, which is precisely why I don’t try to guess these things.
What happened in April is also a demonstration of how price drives narratives. I remember that in the days following Liberation Day, there was a bit of hope that these measures would quickly be reversed. This didn’t happen, and as markets sank, sentiment started to shift, and many people claimed this would be a catastrophe. I would not dunk on these people (because it could definitely end up being a catastrophe) were it not for the fact that many of these same people now remain silent and have flipped bullish as the market recovered. It’s okay to flip from bearish to bullish fast (I actually think it’s a superpower in investing), but maybe doing it when absolutely nothing has changed (just stock prices) makes it seem like sentiment is driving the pivot.
I actually love financial markets just based on the fact that it’s very tough to manage one’s emotions. Financial markets are also a case of “you can’t imagine it until you live it.” It’s not the same reading about everything that happened during the Global Financial Crisis as being invested through it. Financial markets can also, occasionally, become a huge echo chamber. If you are active on X, then it’s pretty easy to understand how this works. There are basically two truths at all times in financial markets.
First, someone will be making more money than you at any given moment. This is also true for fund managers who must “fight” against a list of the top 10 performing funds yearly. The top 10 performing funds in any given year don’t tend to make the list the next year or for many years. Coincidence? I don’t think so.
Acknowledging that someone is going to be making more money than you is fine and should be easy if it weren’t for the second truth: those who are making more money than you are going to make sure you know. This is an interesting dynamic because it’s driven by the X algo, too. People who are enjoying strong performance will post their performance online. These posts will most likely get engagement, and therefore, the algorithm will make you see them. There’s also nothing to counter them because people suffering a bad year will likely not post about it. The way to correct for this is to always look at inception-to-date returns, which are honestly the only returns that matter (it would be great to have an outstanding year every year, though).
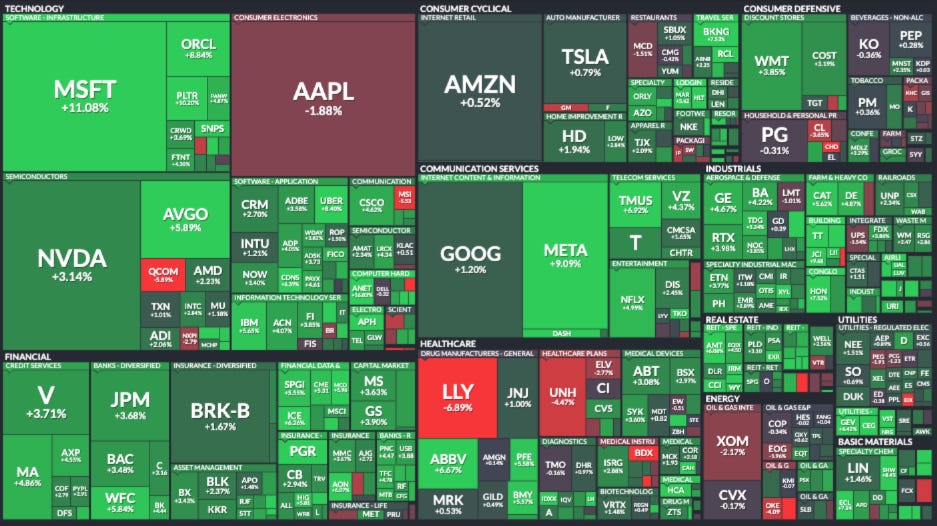
The industry map was mostly green this week with several noticeable exceptions (something normal if we consider we are in earnings season):
The fear and greed index reflects what I discussed about price driving sentiments. It’s already close to neutral after being as low as 4 this month!

It would be interesting to plot the fear and greed index against the performance of an index to see how useful it is as a contrarian indicator. I would say it’s pretty good considering that the low this month was reached on April 4th, and indices are up double digits since.