

Unpacking the drivers of value creation
A practical guide

I’ve increasingly been discussing topics like cash on cash returns and reinvestment rate in my in-depth reports and other related articles, so some of you have asked me to write an article explaining how I use these variables to frame my investment philosophy. The goal of this article is precisely that, and also to help you understand what drives total shareholder return by going deep into some of its subsegments.
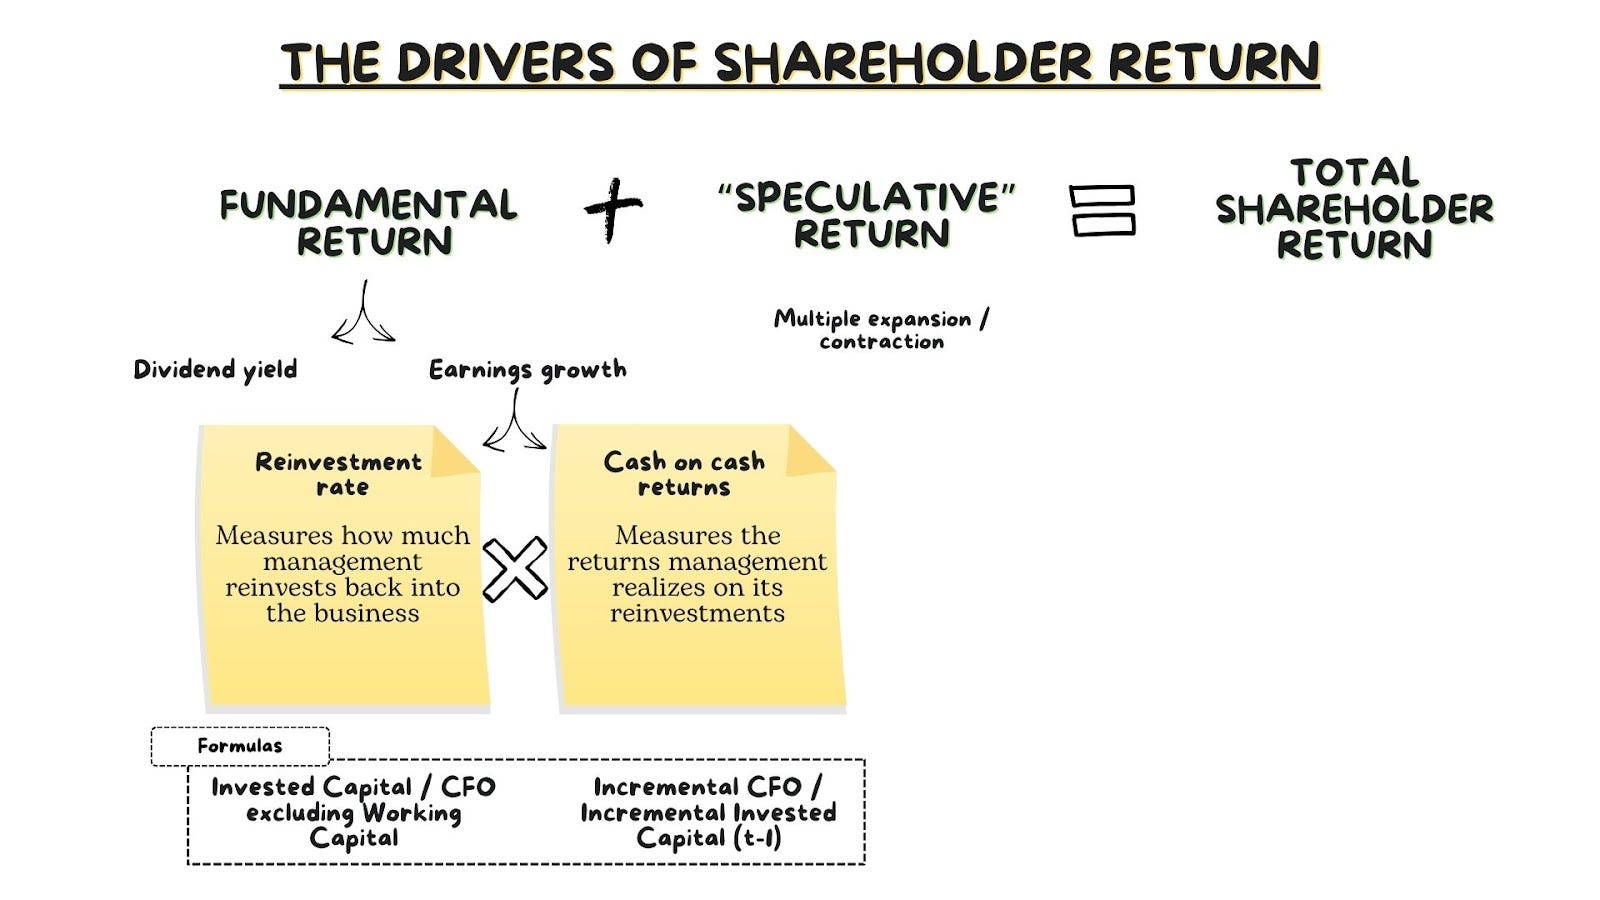
Total shareholder return is driven by two primary variables: fundamentals and valuation. The former (fundamentals) is comprised of two sub-variables:
Per share earnings growth (either cash or accounting profits)
Dividend payments to shareholders (buybacks are already accounted for in per share earnings growth)
Both are entirely dependent on the development of the underlying business. The only difference is that not all per-share earnings are distributed as dividends. I’ll focus most of this article on per-share earnings growth, but let’s briefly discuss valuation.
Valuation refers to the multiple the market assigns to a given earnings level at a given point in time. While today’s earnings level and dividend yield are known variables, the multiple incorporates various unknown and subjective variables, making it much more subject to rapid changes driven by investor perception.
For stable companies, multiples tend to be much more volatile than earnings because they are almost entirely dependent on investor judgement and/or perception (which have no “limit” as to how much they can vary in a given period). It’s for this reason that, over short investment horizons, it’s multiples that tend to drive shareholder returns. However, over more extended periods, it’s earnings growth that matters the most. Besides the fact that one can change faster than the other, the reason for this is that multiples “tend” to stay inside a given range, whereas earnings can compound for years and enjoy “uncapped” upside. Bubble theorists will tell me that multiples can also expand to “unfathomable” levels, and while true, this doesn’t change the fact that earnings growth can far surpass multiple expansion over more extended periods.
James Bullock from Lindsell Train wrote an excellent piece discussing this topic and how earnings growth matters the most over more extended periods. He used an extreme (and unrealistic) example to drive his point home:

The “just 2.8% per annum” should be contextualized. 2.8% per annum compounded over 79 years turns out to be a significant sum of money (the power of compound interest), but the story's morale doesn’t change: multiple changes not only are unpredictable but their impact also diminishes over time. This, by the way, doesn’t mean that multiples (or valuation for this matter) don’t matter. Multiples evidently do matter, but maybe it’s a good idea to think about the above when having doubts about purchasing the stock of a great company because it trades at 22x earnings rather than at 20x where we’d feel comfortable adding it to our portfolio. The reality is that the 10% differential in the multiple is unlikely to matter much in 5+ years, either if we get the investment right or wrong.
As multiples are unpredictable, dependent on many factors, and less relevant the further out we go, I decided to focus this article on earnings growth and its drivers. Note that earnings growth is also unpredictable, but over long periods I would say that for quality companies…
They are more predictable than multiples
It’s something management can control to a certain extent (they have no control over multiples)
(b) is an interesting topic for another article. Many people disregard how much investment risk is reduced when finding companies that “own their destiny.” These companies tend to trade at higher multiples for a reason: due to a certain mix of factors, the market acknowledges that the company is, to a greater extent, in control of what the numbers will do over the long-term. The most extreme (and utopic) example would be a durable monopolist offering a necessary product that has set its eyes on growing earnings 10% per year over the next 100 years. If we were to calculate the earnings multiple that we can assign to such a company to achieve an 8% return, I think many would be surprised.
Say the company starts with $100 in earnings. Compounded at a 10% clip over 100 years, the ending earnings turn out to be $1.38 million. The PV (Present Value) of this company’s cash flows discounted at our required 8% IRR would be $41,484, which ultimately means that we should be willing to pay around 400x its current earnings (the PV of its future cash flows/current earnings) if we want to achieve an 8% CAGR over the next century, or what’s the same: we should be willing to pay pretty much any multiple.
There’s a catch, though: the real world is not like our utopian scenario. The real world is burdened by uncertainties and therefore earnings 20 years down the road are not yet “locked in.” This means that investors should come up with a realistic view of what earnings might do in the future, always aiming to fall on the conservative (rather than the optimistic) side. The best way to do it (at least in my view), is to unpack the drivers of earnings growth to understand what we have to assume going forward. Let’s take a look at that.
The drivers of earnings growth
Earnings growth is driven by two variables that should be at the top of any investor's mind: the reinvestment rate (i.e., what proportion of its cash profits management reinvests back into the business) and the returns the company is able to generate on these reinvestments. Everything comes together in a very simple formula:
Earnings Growth = Reinvestment rate * Returns generated on these reinvestments
For example, if a company reinvests 50% of its cash flows and generates 30% returns on these investments, earnings will grow 15% (0,5*0,3). Both variables have their intricacies, so let’s start with the reinvestment rate.
We can draw several interesting insights from the reinvestment rate alone (albeit these insights must later be confirmed). The first thing we have to do is understand where a company can reinvest its profits. For the scope of this article, I’ll focus on three reinvestment sources:
Capex
M&A (acquisitions)
Working capital
Businesses can also reinvest significant profits into P&L (Profit & Loss) items like Research and Development or Sales and Marketing. What’s interesting about these income statement investments is that accounting rules treat these like outright expenses rather than investments in most occasions. A company that invests significantly into R&D to drive future earnings growth will probably be showing depressed current earnings that will result in future inflated earnings if they decide to cut on R&D spending. The reason is that a mismatch between revenue and actual expenses occurs when a company expends some long-term investments. Anyway, let’s start with Capex.
Capex refers to the net purchase of capital equipment, and it can help us draw some insights. If we observe a high portion of profits being reinvested (on average) into Capex, we can assert that the company is most likely Capex heavy. Being Capex heavy can have important implications for the perceived quality of the company and, therefore, for its valuation multiple. This said, there’s no one-size-fits-all.
Capex-heavy businesses are generally perceived as inferior to capital-light companies for several reasons. First, they have to reinvest significant sums of their cash flow into the business just to maintain their operations, meaning that there’s not much left for shareholders. Secondly, these businesses (tend to) suffer significant operating deleverage, meaning their profits can evaporate fast during market drawdowns (the market pays significantly less for volatile earnings, even if these businesses remain widely profitable through such downturns).
On the flipside, Capex heavy companies can enjoy strong competitive positions because a new entrant would need to invest unimaginable sums to get up to speed. There are several examples where this is the case. One can think about TSMC as having a significant advantage over new entrants due to the high Capex required to open a leading edge fab (+$20 billion), but maybe the most obvious example here is Amazon. Amazon has invested tens of billions of dollars into both AWS and its retail fulfilment network, and Andy Jassy has even claimed that a Capex heavy business with attractive returns is what Amazon actively looks for to fence off competition.
The thing is that Amazon enjoys “the best of both worlds.” Its Capex-heavy nature has allowed it to fence off competitors and enjoy an oligopolistic position, allowing the company to come up with a myriad of Capex-light and very profitable product lines (like subscriptions, ads…). Arguably the best example of “very profitable Capex” is Copart. Copart invests most of its Capex on land, which not only doesn’t depreciate but arguably appreciates over time (if you know of a non-real estate company that invests most of its Capex on an appreciating asset please let me know!). Copart couples its physical advantage with a network effect thanks to its online platform.
Note that whether high Capex is good or bad will eventually show itself in the numbers: high Capex coupled with low margins and low returns is a terrible business, but the same can’t be said when high Capex is coupled with high and durable returns and high margins. Airlines are an example of the former, whereas TSMC or Amazon are examples of the latter. I’ve found that it’s rare for Capex to be the only competitive advantage that great companies enjoy (unless we are talking about an extreme example).
M&A refers to net capital deployed into acquisitions. The word “net” is important here because we should deduct divestitures from acquisitions when calculating this number. Finally, working capital refers to movements in current accounts like inventory, payables and/or receivables. This information can be extracted from the cash flow statement.
If we add the three investment sources, we end up with our invested capital number. Rather than treating it as a cumulative variable, I believe it’s best to calculate it for every year. This should allow us to spot any underlying trends quickly and understand what’s driving these and the anomalies along the way. Let’s use Zoetis (ZTS) as an example.
By plotting Zoetis’ annual invested capital numbers, we can see the company has suffered several periods of abnormally high investments: 2018 and 2022/2023. These can also be known as “investment cycles:”

By plotting the three reinvestment sources, we can easily see which source/s drove these investment cycles. The 2018 anomaly was clearly caused by a major acquisition: Abaxis ($2 billion price tag).
The 2022/2023 investment cycle, however, was caused by two sources: increasing Capex and significant investments into working capital. Both originated (to a great extent) on the same product line: Zoetis’ monoclonal antibodies. Those years marked the significant rollout of Librela and Solensia across Europe and preparations ahead of Librela’s launch in the US. Management decided to build inventory and invest in their Mab capacity ahead of this, mainly because they had run out of product when launching in Europe and did not want to repeat the same in the US. We have already seen invested capital drop significantly in 2024 and a further “correction” is expected in 2025 (Zoetis divested its Phibro Animal Health business, for example) due to a return of a more normalized reinvestment cycle.
So, while the reinvestment dollars will not tell us much on their own, I believe it’s a very useful metric to understand where the company is investing and whether those investments are normalized. The end goal of this exercise should be to calculate the reinvestment rate. For this, we simply need to calculate Cash Flow from Operations excluding Working Capital.
We must exclude working capital because we are including it as an invested capital item, so if we were not to exclude it from CFO, then we would be “double counting.” Once we have calculated CFO excluding working capital, all we have to do is divide invested capital by this figure.
Reinvestment rate = Invested Capital / CFO excluding working capital
Zoetis’ average reinvestment rate over the last decade has been 59%. One might wonder what is an “appropriate” reinvestment rate, and while I would much rather prefer to be useful by providing an exact answer, the answer is: it depends. It depends because a company should reinvest as much profits as it can so long as the returns it expects to generate from these are above the cost of capital. This means an 80% reinvestment rate might be good or bad depending on the company. If a company can generate returns above its cost of capital when investing a maximum of 60% of its money, it shouldn’t spend one dollar more or one dollar less. Reality is much more complex than this simple math because returns are unknown, but you get me.
Let’s talk about returns now, the other key variable here. Theory (and practice) states that a company should undertake any investments it can undertake so long as it expects a return over its cost of capital. This cost of capital is typically known as the WACC or Weighted Average Cost of Capital and considers where the funds come from. Judges Scientific is a good example of why the source of the financing matters (you can read my in-depth report here). Judges has historically used debt to finance its acquisitions, so it has incurred a cost of capital of around 3-8% over the last decade. However, should the company issue equity to undertake these acquisitions, the cost of capital would be significantly higher and therefore it would need to look for higher-return acquisitions to make the numbers work.
Investors calculate returns in many ways. You will have probably heard about ROIC (Return on invested capital), ROCE (Return on Capital Employed) or ROE (Return on Equity). While these metrics provide investors with useful information, I would like to discuss cash on cash returns. I came across cash on cash returns through my good friend Andy Feldman (we discussed this concept in a recent podcast).
Cash on cash returns are pretty much self-explanatory: they measure the cash profits that cash investments are returning. To calculate cash on cash returns, we simply have to divide the incremental CFO excluding working capital for a given period over the sum of the invested capital for that period. Note that we should not consider the invested capital of the year we are calculating the cash on cash returns for. The reason is that those investments have not had time to bear fruit and therefore it would be unfair to include them in the calculation.
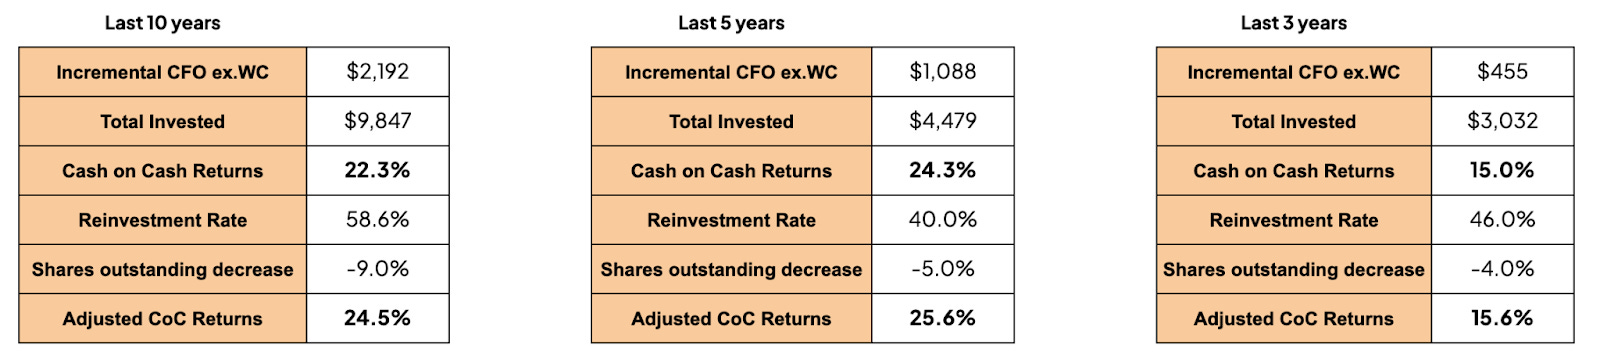
Following with the Zoetis example, the company has generated the following cash on cash returns over the last 10, 5, and 3 years:

We can also draw valuable insights from this metric. The first thing we can observe is that Zoetis’ returns lie comfortably above its cost of capital. There’s no need to calculate the WACC to understand whether a business is generating value if returns lie significantly above any conservative measure of WACC. I would even go as far as to say that if you need to calculate WACC to understand if a business is adding value, then your margin of safety is probably too low! The return-WACC differential evidently matters because the wider it is, the more value the company adds per unit of growth, but we’ll keep things simple here.
The numbers above also demonstrate that Zoetis’ cash-on-cash returns have decreased over the last few years. This is evidenced by the fact that the returns over the last five years are significantly higher than those of the last three years. I’ve already discussed the reason for this: an investment cycle that will bear fruit down the road. Once these increased investments start to bear fruit (2024 showed early signs), we should see returns bounce back.
With these numbers, we can understand how everything comes into play. Earnings growth is a function of the reinvestment rate and cash-on-cash returns. Zoetis’ example should help us corroborate this formula. Over the past 10 years, Zoetis has reinvested 59% of its cash flows and generated cash-on-cash returns of 22%. Multiplying both, we find that cash flow growth should have compounded at around a 13% CAGR, which is what it did over that period.
Using the exercise above to look forward
The exercise above is very useful for examining the past because it helps us understand what has driven the growth of a given company and its business model. It’s also a potent tool to look forward. Let me explain how I use it when assessing valuation.
The first thing I do when valuing a company is to build an inverse DCF. The inverse DCF helps me understand what cash flow growth rates are “baked” into the current price (i.e., how much the company needs to grow to be a good investment). Once I find out these, the goal is to judge how reasonable they are; this is where the underlying drivers of earnings growth come in handy. If the inverse DCF shows that cash flows have to grow at a 10% CAGR over the next decade (to justify a given level of return), I try to unpack its drivers to understand how reasonable that is. Let’s see how this works with a hypothetical example.
Say that you are looking at a mature company with few reinvestment opportunities. The inverse DCF shows it must grow its cash flows at a 15% clip over the next decade (3% terminal rate). The company has reinvested around 20% of its capital in the past and, absent significant reinvestment opportunities, you believe it will be the same way in the future. This means that cash on cash returns need to be around 75% to result in earnings growth of 15%. Not impossible if it’s an outstanding capital-light business, but now you have something else to think about: can the business generate 75% cash on cash returns consistently over the next decade? This way of framing valuation helps you think about the things that matter.
Introducing SBC and dilution to the exercise
SBC and the respective dilution that comes with it become relevant topics here. The reason is that absolute returns might be inflated or depressed if there has been significant dilution or share buybacks. In short: it’s not the same to generate attractive cash on cash returns while at the same time diluting your shareholders rather than making these returns more accretive to remaining shareholders by buying back stock!
At first I thought that a good idea might be to simply adjust the operating cash flow for SBC to ignore the cash benefits of paying your employees with shares. However, my good friend Andy reasoned that SBC is not the same as dilution, and this is evidently true. The SBC expense is calculated using the Black-Scholes formula and considers many variables. For example, higher volatility in a company’s stock price can lead to a higher SBC expense without this meaning that dilution will be higher down the road. Andy also shared his way (and a great way) of taking dilution into account: adjusting the resulting cash on cash return by the dilution/buybacks that have happened over the period.
Let’s continue with the example of Zoetis. Over the last 10 years, Zoetis has generated attractive cash on cash returns of 22% and has reduced its outstanding shares by 9%. To adjust our cash on cash returns, we simply divide the 22% by (1+change in shares outstanding). In Zoetis’ case, this would be 22% divided by 0.91 (1-0.09), resulting in adjusted cash on cash returns of 24.5%. The interpretation of this result is relatively straightforward: existing shareholders have been rewarded more than the absolute return number portrays because they became owners of a larger proportion of the cash flow growth that Zoetis generated over the period.
Take, for example, a hypothetical company that has generated excellent cash on cash returns over the last decade of 30%. While these may seem spectacular, this business has also diluted shareholders 30% during the period. This means that actual returns to remaining shareholders have been closer to 23%. Still great, but far off the 30% absolute return number. Also note that, while a 700 basis point differential might not seem significant, it’s pretty significant when compounded over a decade.
I hope this article helped you build a framework around…
What drives shareholder return
What drives the fundamental return embedded in the shareholder return
How to think about these drivers
In case your head is all mixed up with what I have discussed here, I decided to build a chart outlining what we’ve spoken about:
I believe you’d also find pretty useful this podcast where I had a conversation about these topics with my good friend Andy Feldman:
I hope you enjoyed this article and see you in the next one!
Great article, Leandro !
a quick question - Since this approach focuses on OCF and OCF yield on new investments, do you still use FCF for your reverse DCF calculations? or do you derive a value based on OCFs and make adjustments to the final numbers to arrive at the implied equity value?
Thanks for the great article, Leandro!
Couple of questions:
1) What data source do you use for the financial data and could it be that the numbers you are using are shifted with 1 year? Meaning that the numbers from 2024 are actually the numbers of 2023? I use Finchat data and these do not seem to match.
2) When you mention Cash Flow from Operations excluding Working Capital, do you mean Cash Flow from Operations excluding changes in Working Capital?
3) For calculating the last 10 years Total invested (assuming the last available year of data is 2024), do you sum the total invested capital from 2014 until 2023 and thus excluding the invested capital in 2024?
4) Using the logic I described above, I seem to get Adjusted CoC Returns in the ranges of 22% (10Y), 20% (5Y) and 9.5% (3Y) which look a bit less optimistic..