

The PE ratio: Not All Growth Is Created Equal

Reading time: 12 - 15 minutes.
The premium subscription gives you access to all the content in Best Anchor Stocks, which includes…
All the deep dives
Recurring articles
Access to my real-time portfolio and transactions
Occasional webinars on various topics
A community of like-minded investors
A subscription the Premium + also gets you a quarterly Q&A with me to discuss anything you’d like.
If you want to know the type of content I share at Best Anchor Stocks you can read the Deere deep dive I uploaded a few weeks ago for free…
…or you can also read any of the other many free articles I have shared, just like this one!
You can also read the testimonials that existing subscribers have left. If you are a passionate and curious investor wanting to learn about high-quality companies, don’t hesitate to join Best Anchor Stocks!
Hello reader,
Thoughts for an article about the PE ratio had circled my head for some time already. Despite being the most widely used stock valuation ratio, the PE ratio is probably the most misunderstood as well.
If you follow the market, you will see many investors making claims about the cheapness or expensiveness of certain stocks based on their PE alone. However, as much as this rationale might seem logical, there’s much more to PEs and their interpretation.
This article aims to provide a framework to contextualize PE ratios beyond the “headline” numbers. If you are one of those investors who mainly look at the PE ratio to judge whether the valuation is appropriate, I hope this article can help you think about the underlying drivers of the PE ratio.
I’ll go over the following topics:
What is the PE ratio?
Where does the PE ratio fit in the return of an investment?
Not all growth is created equal.
Why do high-quality companies tend to trade at premium multiples?
The past as a proxy for the future.
Conclusion
As you can see from the index, the article discusses the role of the PE ratio in the search for high-quality companies. Without further ado, let’s go!
What is the PE ratio?
The PE or Price-to-Earnings ratio is a valuation ratio that divides a company’s stock price by its earnings per share (EPS):
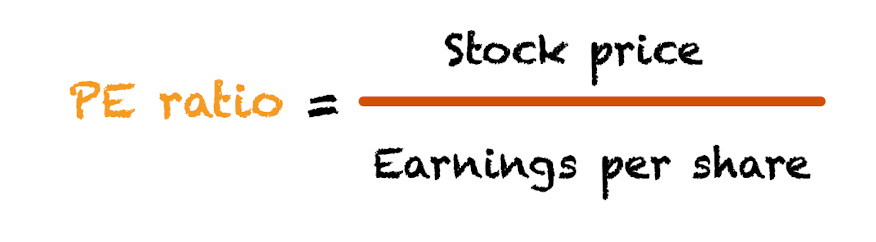
Calculating it is straightforward as the EPS (Earnings per Share) can find on the income statement. The problem with the PE ratio comes from its interpretation, though, not its calculation.
Intuitively, the higher the PE ratio, the higher the expected growth rate that is baked into the company’s stock. Simply put, if a company is expected to see above-average growth, it will most likely have an above-average PE multiple. If, conversely, a company is expected to enjoy below-average growth, the market will assign a below-average multiple.
Ultimately, PE ratios tend to converge to the mean once growth slows down and the company settles into a “steady” state. The rationale is that high growth doesn’t last forever, and competitive advantages are eventually competed away.
Mean reversion works both ways, though. Suppose a company has a lower-than-average multiple but achieves average EPS growth. In that case, the multiple should eventually converge to the mean, helping investors enjoy some of their return from a multiple expansion. Conversely, suppose a company has an above-average-multiple but cannot “live up” to this growth. In that case, the multiple will compress, making the investor suffer a loss, at least for the short term, from a multiple contraction.
A great part of the value investing philosophy is based this mean reversion phenomenon. Value investors typically look for companies that are under-appreciated by the market, hoping to buy them at a discount and realizing most of their gain from a multiple expansion once the market acknowledges that the company does not deserve a lower-than-average multiple. It’s a fair approach but one that I would have trouble implementing, as my returns would depend more on how the market values the company’s cash flow and not the cash flows per se. You also need very good timing skills, not just for the company’s results, but also for the markets reaction to them.
Assuming that a multiple will stay at the same level forever is misleading because growth eventually slows. Multiples will eventually contract, reflecting the lower growth. This is why investors tend to assume a lower multiple at exit when they make a discounted cash flow model. We’ll talk a bit about this later.
Where does the PE ratio fit in investment returns?
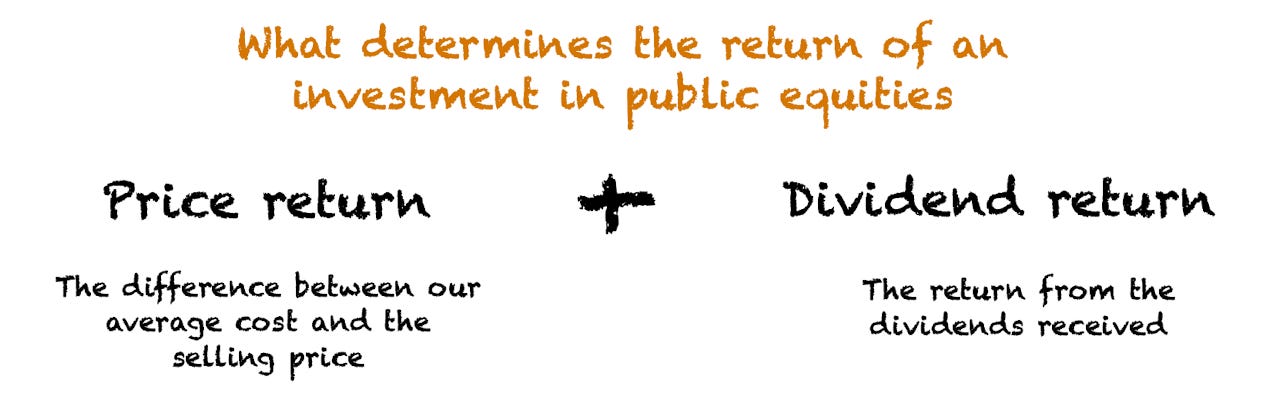
Two variables determine the return of any investment in public equities: price return and dividend return.
The dividend return is straightforward. Some companies will have excess cash after reinvesting in the business and will give this cash back to shareholders.
The price return is the difference between the selling price and the average position cost.
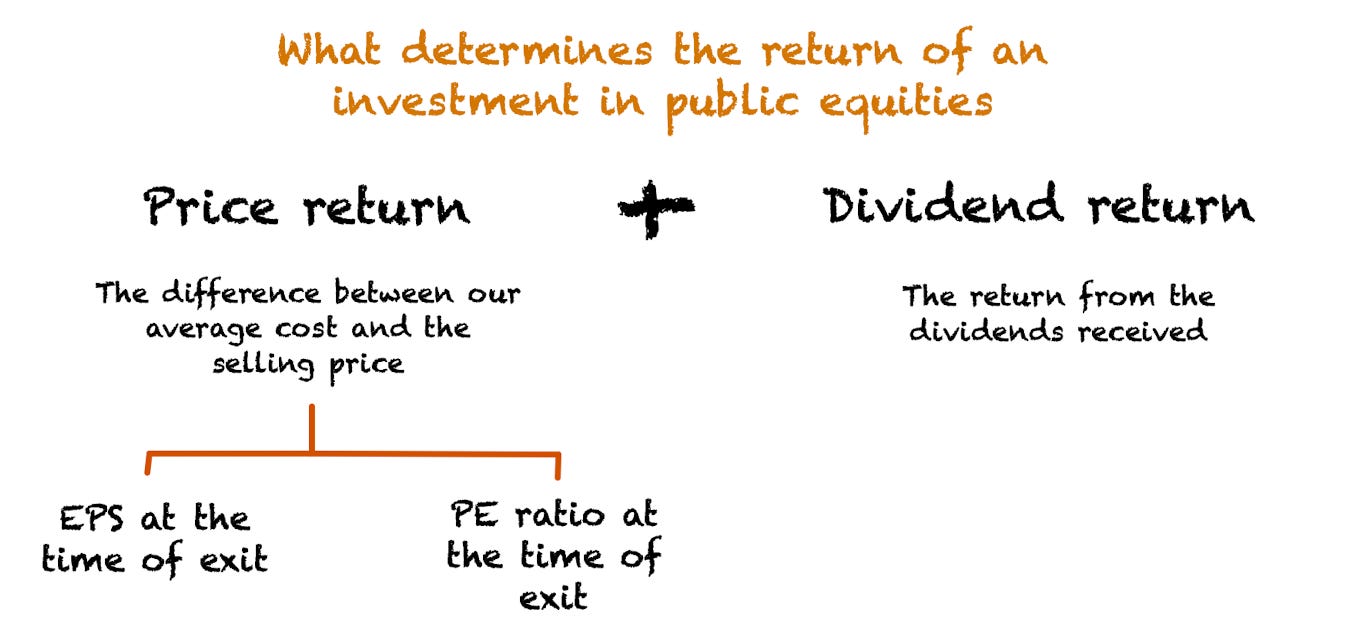
I want to dig a bit deeper into the price return because, despite being straightforward to calculate, it’s a bit “trickier” due to the co-existence of two growth drivers. Based on what we have already discussed, the price return of an investment will be driven by its earnings at the time of exit (so its earnings growth) and multiple at the time of exit (so multiple contraction/expansion).
Say, for example, that an investor buys a company currently trading at a 25x PE ratio with an EPS of $5 (I’ll use round numbers to make it simple). Using the PE formula shared above, we get a stock price of $125.
This investor expects the company to grow EPS at a 10% CAGR for the next decade. This means that at the end of year 10, the company will have EPS of $13. However, the investor also expects the market to rerate the multiple to a lower level in year 10 due to the expectation of lower growth ahead. They think it will end up trading at a PE of 15x.
This means that the stock price at the end of year 10 is $195 (15 (PE ratio) * 13 (EPS)), yielding a price annualized return of just 4.55%. EPS grew faster than 4.55%, but the multiple contraction weighed on the returns for the investor. Multiple expansions and contractions tend to have a larger impact on returns over shorter periods. I wrote a bit about it here:

The above is an extreme example and rarely will an investor experience such a wide divergence in multiples.
However, there’s no denying that valuation (and thus multiples) is a significant driver of returns, especially when the rerating is very significant. The rationale is that the selling price not only depends on how the company does but also on how the market rates this performance and the business's future prospects.
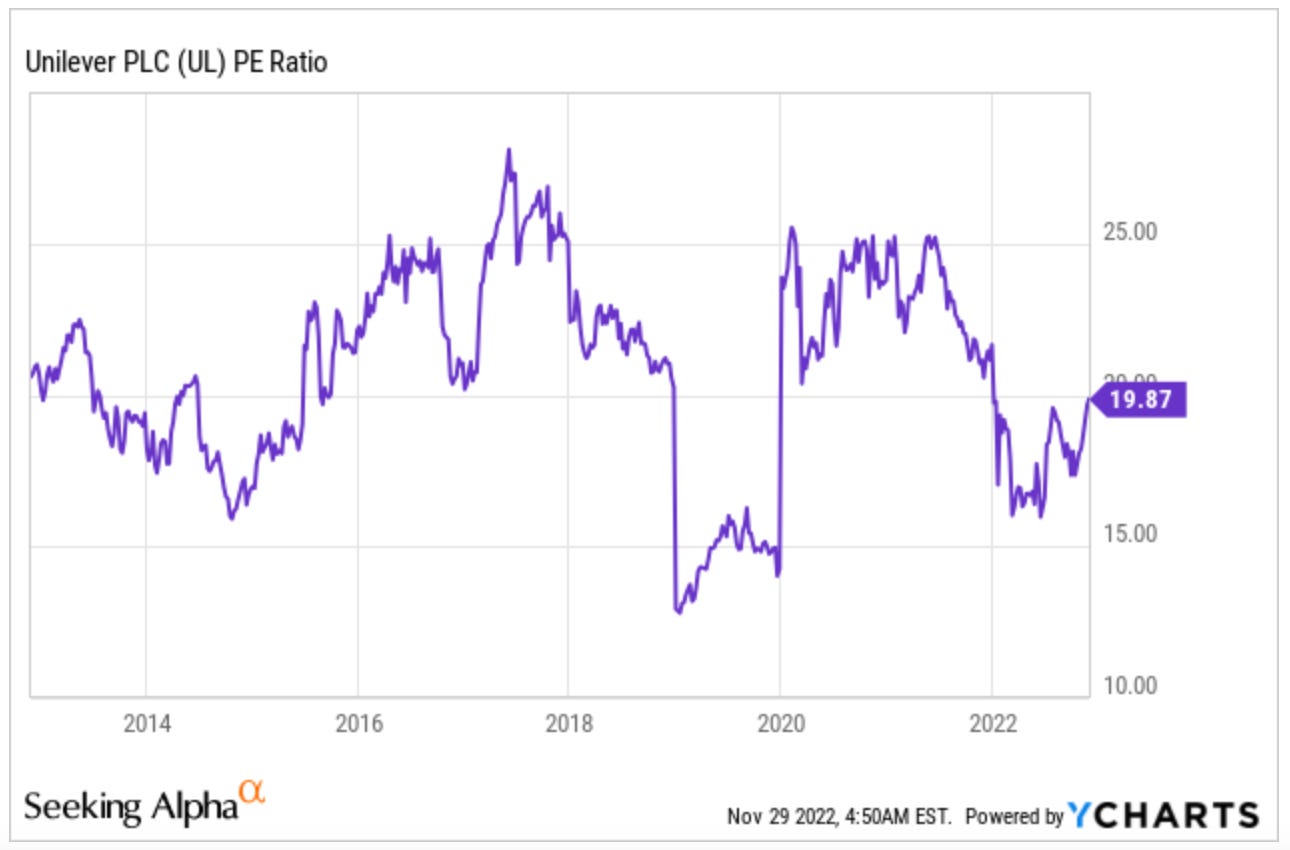
For this reason, it’s always important to estimate what our multiple in 10 years’ time might look like. Some investors assume it will be lower, but the key lies in how much lower it will be. If a company’s PE ratio enjoys a premium compared to the market, this doesn’t mean it will converge to the market’s multiple in 10 years. Take for example Unilever ($UL). It’s trading today at roughly the same multiple as it did a decade ago:
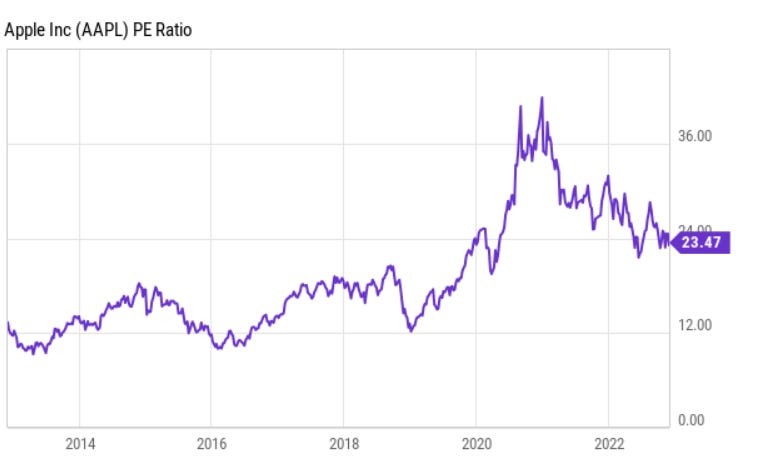
Many PE ratios have even gone up. Just look at Apple’s ($AAPL) for example. It was around 12 a decade ago and now its PE ratio is almost double, at 23.5.
I would say that what’s important is that investors try not to buy a company that is trading say at 50x earnings that will end up trading at 10x earnings in 10 years. In that case, the company has to perform really well to avoid the multiple contraction severely impacting the investor’s returns. On the contrary, it’s unlikely that if an investor buys a great company at 28x earnings, a multiple contraction to let’s say, 25x, will put a meaningful dent in their returns over the course of a decade.
Company performance and the PE ratio are both important and closely related, but the tie between both goes far beyond expected growth rates. Not all growth is created equal.
If you are enjoying today’s post, feel free to subscribe to have future posts directly sent to your inbox!
Not all growth is created equal…
And the market knows this, to an extent
Judging by the previous section, we might be inclined to believe that two companies with the same expected EPS growth for the years to come should trade at exactly the same multiple. However, this is rarely the case in the market. Why? The answer lies in the cash generation capacity.
Not all growth is created equal, so we must consider the variables driving EPS growth. Earnings growth will ultimately be determined by the reinvestment rate and the Return on Invested Capital (ROIC).

The reinvestment rate measures the amount of earnings that the company plows back into the business every year. The ROIC measures the return the company makes on these reinvested earnings.
So, how much must a company reinvest into its business to grow earnings by 10%? The answer is that it depends on the returns that the company can achieve by investing these earnings. To achieve a 10% earnings growth, any of the below combinations of ROIC and reinvestment is valid (there are many many more):
Reinvesting 100% of earnings with a 10% ROIC
Reinvesting 50% of earnings with a 20% ROIC
Reinvesting 25% of earnings with a 40% ROIC
…
But, which combination is better? This answer is not as straightforward as it seems. We might be inclined to think that reinvesting less to achieve the same level of growth is always preferred. This is true in most cases, but high reinvestment needs also serve in some cases as strong moats that help fence off competition. If a company can grow with very little reinvestment, a disruptor might be able to eat the company’s lunch without needing too much initial capital.
However, for the sake of this article, let’s assume that less reinvestment to achieve the same level of growth is always preferred.
So, what’s the thought process behind this? Eventually, every investor should think about future cash flows. The goal for any investor is to make a positive return, and this return comes from the differential between the price paid and the cash flows received. So, for example, if we pay $100 for an asset and want to realize a 10% annualized return over a decade, we must get $260 in cash flows, which can come from recurring cash flows, selling the asset for a higher price, or from both. Note that here I am talking about realized returns, not unrealized gains.
In the case of an equity investment, the recurring cash flows come from the company returning excess cash to shareholders, both through dividends and stock buybacks, or through selling at a higher price, of course. If a company spends less to grow, there’s more cash available for shareholders, and thus there’s a potential higher return from dividends or share repurchases but potentially a lower return on the stock price.
When you see a divergence between the PEs of two companies with similar growth prospects, you should first look at the underlying earnings growth drivers instead of claiming that one is expensive and the other is cheap. The higher PE company might have more cash flows available for shareholders. The bottom line is that it’s basically impossible to judge whether a company is cheap or expensive based only on the PE ratio and a growth rate, despite this being how the PE ratio is commonly used. PEG ratios also fail to capture the movement in the underlying growth drivers, so they aren’t that useful either.
All things equal, the higher the ROIC spread (ROIC - Cost of capital), the higher the PE can be without impairing the required returns. Here’s a table that depicts how ROIC and earnings growth determine the justified PE ratio for a company using a required return of 9.5%:
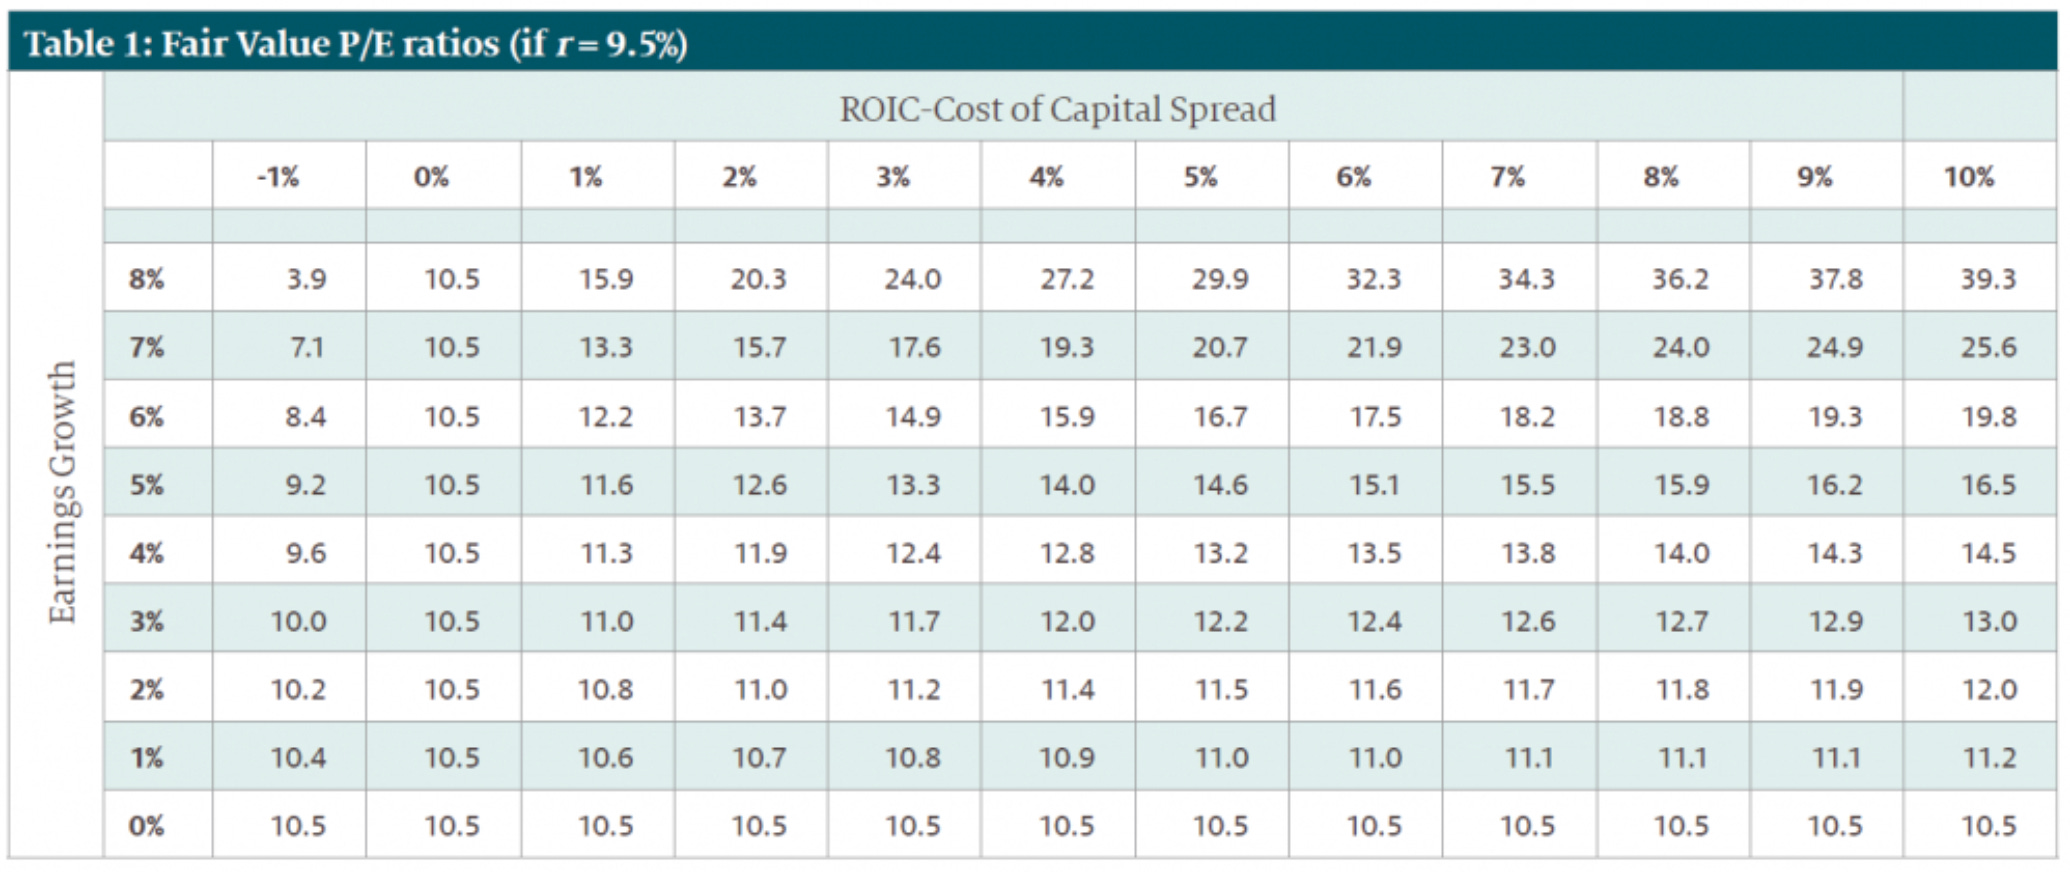
Source: Epoch Investment Partners
If the spread is negative, then there’s value destruction with growth. When the spread is 0, then growth does not create value. However, when the spread is positive, there’s value creation with growth. This value creation is much better at higher ROIC spreads because the company can achieve it while having more cash to spare for shareholders.
The answer always lies in cash, and despite the PE ratio being an “income statement” ratio, it’s no different.
Why high-quality companies tend to trade at high (but typically not high enough) multiples
The above is one of the reasons why high-quality companies tend to trade at premium multiples. These companies typically have high ROIC spreads and thus don’t need much reinvestment to create growth. It would be pretty interesting to adjust PE ratios for this ROIC differential to understand how much of the multiple premium comes from the ROIC premium.
However, the market typically focuses on the future, so the reason why they trade at premium multiples is not due to a current high ROIC spread but due to the market’s belief that this ROIC spread will be maintained going forward.
Mean reversion is a powerful force impacting most publicly traded companies. However, a select group of companies can protect their returns through solid competitive advantages or what Warren Buffett called “moats.” These competitive advantages allow these companies to defer capitalism's forces, enjoying higher returns for more extended periods than any conservative valuation model would account for. Let me explain.
One of the primary tools investors use to forecast returns is the discounted cash flow model, but this model was not made for the minority of companies that can sustain high returns over time. It was made for the vast majority of companies that experience mean reversion. For this reason, DCF models typically forecast 5 years out and drop the growth rate from year 5 to what is called a terminal growth rate. The terminal growth rate assumes that growth falls to steady state and excess returns are competed away.
This “fast” mean reversion makes DCF models ill-equipped to forecast the cash flows of companies with strong moats. If we drop the growth of a high-quality business after year 5 to a steady state, the model is missing a very large portion of the free cash flow creation of the business:

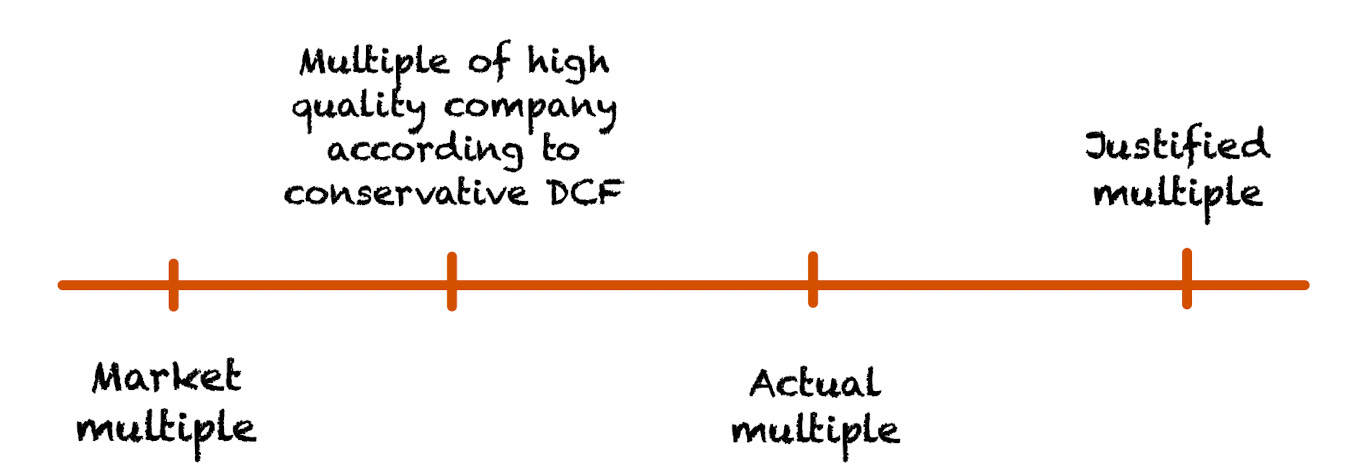
This is why high-quality companies will almost always appear optically overvalued using a standard DCF model. The limitations of this model make it almost impossible to grasp the earnings power of high-quality businesses. These companies always look expensive because the market can look ahead to a 5-year DCF, but rarely does the market look at value creation beyond the 10-year mark. This creates a situation where high-quality companies appear optically expensive but are indeed systemically undervalued:
I don’t want to be misinterpreted here. I am not implying that all high-quality companies are undervalued now. First of all, high-quality companies that can remain high-quality for decades are scarce. Secondly, high-quality companies also go through periods of extreme over-valuation. What I am trying to say is that, in many cases, there’s an explanation for the premium multiple these companies enjoy and, in many cases, it might even be understated.
So, how can we “fix” the discounted cash flow model so that it accounts for these flaws? I think there are two main ways. The first and most obvious one is projecting a higher terminal growth rate. Note that this terminal growth rate should not be (in nominal terms) higher than the GDP nominal growth rate, or else we would be implying that the company eventually gets larger than the economy, which seems highly unlikely.
The second method (and the one I personally use) is the inverse DCF. With an inverse DCF, we work backward, determining what growth is baked into the stock price. Suppose the growth rates we get out of our inverse DCF seem reasonable with an average terminal growth rate. In that case, we might conclude that the company is undervalued because high-quality companies will prove that the terminal growth rate should’ve been higher. Note that this method only works if the company is high-quality and has some form of competitive advantages. This is the first requirement. In my opinion, investors should spend almost all of their time: analyzing the company. It’s impossible to judge whether a company is cheap or expensive just by looking at the valuation ratios. Valuation ratios always need context.
The past as the proxy of the future
Answering the most important question
Based on the previous section, I think the most important question any investor should answer is:
Will this company have high sustained returns over the next 20 years?
Even if your holding period is under 20 years (let’s say 10), you should look 20 years out because the market is forward-looking. Most likely, the multiple will anticipate the competitive dynamics of the coming years. This applies to any holding period. If your holding period is 1 year, you should also look ahead.
Estimating something that is 20 years out is almost impossible, but the past tends to be a pretty good indicator here. If a company has been able to sustain high returns for two decades already, this means it might have something special, and it should serve as a good starting point. Has anything changed that will make the future look different from the past, or are these competitive advantages structural?
Despite evidence of durable competitive advantages, the market will systemically undervalue such companies, “hoping” for a return to the mean that will inevitably come. The question is not “if” it will come; the question is “when,” and this “when” is still decades away for some companies.
If you enjoyed today’s post, feel free to subscribe to the blog to receive further updates directly in your inbox!
Conclusion
Few investors calculate earnings ratios incorrectly, but many fall into incorrect interpretations. There’s much more to PE ratios than the number combined with growth because not all growth is created equal. The market is well aware of this phenomenon but often fails to account for durability in competitive advantages. Of all the possible edges that investors can have, this “time edge” is probably the most relevant for any individual investor and the easiest to enjoy. The rationale is that Wall Street can’t look that far out due to its incentive schemes, and most people cannot slowly compound their capital at the risk of boredom.
Companies with sustained competitive advantages are scarce, but one does not have to build a portfolio of 300 publicly traded securities. A portfolio of 10 or 20 positions can be enough to diversify, and there are undoubtedly enough high-quality companies out there. How can we find them? The past is no perfect proxy for the future, but it will certainly serve as a good starting point for the search.
I hope you enjoyed this article and, in the meantime, keep growing!
One of the best PE breakdown I read. Great job!
Great write up! Love the part about how most people evaluate in short time periods negating the effects of a potentially long growth runway.