

The Hidden Costs That Hinder Long-Term Returns

A portfolio is like a bar of soap, the more you handle it, the smaller it gets. - Wall Street Adage
Hi reader,
We recently came to the close of Q3 and, with it, to the season of screenshots from people showing how well they have been doing year to date. This might lead one to think that everyone is doing better than them, but there are several caveats to this conclusion…
There’s survivorship bias: you’ll probably see the returns of those who have done great because they are most likely to post these. It’s also highly likely these will get engagement, and the algorithm will make them viral
They are YTD (year-to-date) returns, which honestly don’t matter much over the long term. This is the reason why I only share inception-to-date returns; in my view, this is the only return that matters
Returns shown are (in 99.9% of the cases) gross returns and ignore two things: (a) how much risk an investor took to generate them, and (b) how many hidden costs were incurred in achieving them
#1 and #2 are straightforward to understand, and #3a is basically impossible to calculate accurately (although a longer-term track record should do the trick), so I will focus this article on #3b: the hidden costs.
Many investors know that commissions and taxes can significantly eat up one’s investment returns, but I think few have worked on the numbers to understand the tangible and numerical impact. I must say that I was impressed while writing this article by how much of an impact these hidden costs (which bypass the return shown in our brokerage) can have on an investor’s long-term returns. You’ll understand why after reading this article, but I can already tell you that such “hidden” costs carry other hidden costs that many investors tend to disregard.
Before jumping into the numbers, let me briefly discuss the “experiment” at hand.
Setting up the experiment
I’ll work with three fictional characters who will imitate the behavior of three different types of investors:
The frequent trader: rotates the entire portfolio at the end of the year to buy new positions, leading to commissions equal to 1% of the portfolio value every year.
The active investor: rotates part of the portfolio at the end of every year, leading to the sale of 30% of their unrealized gains. As it trades less than the frequent trader, commissions amount to 0.5% of the overall value of the portfolio
The passive or buy-and-hold investor: does minimal rotation, only selling 10% of its unrealized gains yearly. As transactions are kept to a minimum, this investor pays 0.2% in commissions as a percentage of overall portfolio value
Note that the examples (and the numbers) here are fictional and only intend to differentiate three types of investors in terms of how active they trade their portfolios. Real life is much more complex, but the objective of this article is to show how much these costs can potentially hinder long-term returns.
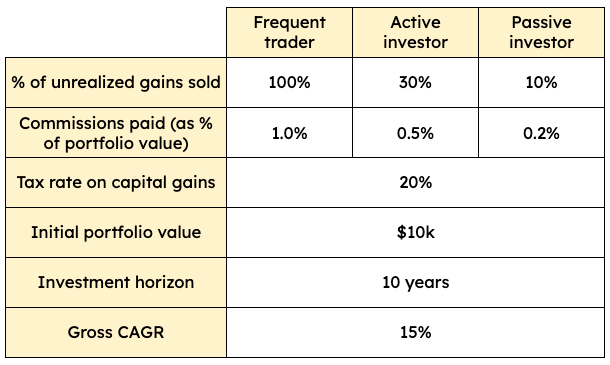
Then, we have to move on to the assumptions that are common across all three fictional characters:
The tax rate on capital gains in the country these investors operate in is 20%
They all start with a $10k portfolio
The investment horizon is 10 years
All the players compound at a 15% CAGR (gross) over the investment period
Below, you can find a brief summary of the assumptions that underlie the experiment:
As discussed at the beginning of the article, most people would be aware that the frequent trader would have higher hidden costs (taxes and commissions) based on their strategy, but probably few would be able to quantify how much of a drag this can be for future returns.
To conduct this experiment, I also assumed that the money required to pay taxes and commissions comes directly from the portfolio itself. This means that the amount due in taxes and commissions is not available to reinvest the following year, which is true in the case of commissions in real life but undoubtedly not true in the case of taxes which are typically paid using other means (like a bank account). The latter can give an investor the illusion that they are not “losing” reinvestment power, something that’s not true considering this money has to come from somewhere and, therefore, decreases their net worth.
Let’s look at the three scenarios.
The frequent trader’s performance
So, the frequent trader starts with $10k and generates a 15% gross CAGR but incurs significant taxes and commission expenses. By the end of the 10 years, the frequent trader has paid…
$6,091 in taxes
$2,355 in commissions
…for a total of $8,426 in “hidden” costs (I hope this clarifies why the financial industry is interested in volatility and in frequent trading). Interestingly, the impact on their net portfolio return is much greater due to how compounding works.
The frequent trader accumulates a gross return CAGR of 15%, ending with a portfolio value of $40,456. However, his net return CAGR is “just” 10%, resulting in an ending portfolio value of $25,856. The difference between gross and net ending portfolio values is a whopping $14,600. This is significantly higher than the $8,426 directly paid in hidden costs because there’s a significant component of opportunity cost: the money that is paid in taxes and commissions can’t be reinvested, and therefore, the frequent trader not only gives up that money but also all the compounding that would’ve come with it. At a 15% CAGR, $10 “given up” at the beginning of the compounding period would detract almost $40 from the portfolio's ending value. Of course, as not all the money is forfeited at the start of the period, the impact to the ending value diminishes with time. For example, $10 forfeited in year 5 would have an impact of $20, not $40, on the portfolio's ending value.
The difference in gross and net return CAGR is already substantial in and of itself, but it’s even more astonishing when we look at the total return. The frequent trader's gross return over the 10 years is 305%, but his net return is 159%. This means that, by trading frequently, the frequent trader “gave up” almost half of their returns to the broker (commissions) and the Government (taxes). Not a bad deal for these two stakeholders, considering they incurred no financial risk in reaping half of the frequent trader’s return who incurred financial risk:

Let’s go to the “middle ground” now.
The active investor’s performance
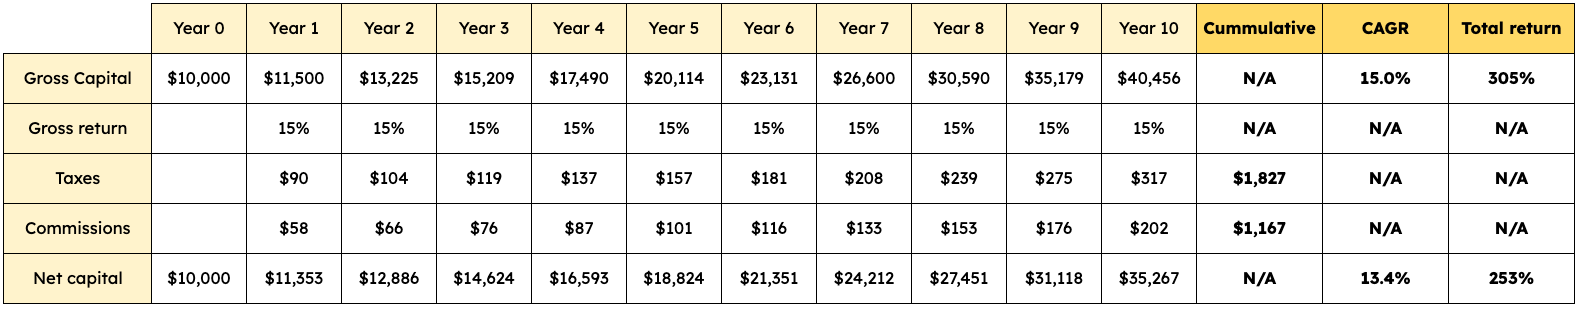
As discussed above, the active investor also starts with $10k and achieves a gross return CAGR of 15% over the investment period. However, this investor trades less frequently, “only” paying…
$1,827 in taxes
$1,167 in commissions
This brings the cumulative “hidden” costs to $2,995 over the period. Similarly to the frequent trader’s case, the active investor also forfeits the opportunity to reinvest this money back at a 15% CAGR, leading to some “invisible” costs (i.e., opportunity cost). The active investor ends with a net portfolio value of $35,267, much better than that of the frequent investor but still much lower than if they had not incurred those hidden costs (which would’ve yielded an ending portfolio value of $40,456).
The active investor achieves a 13.4% net CAGR, compared to a 15% gross CAGR. The former leads to a total return of 253% compared to a total return of 305% for the latter. Again, it might not look like a significant difference in CAGR, but it’s indeed a significant difference when compounded over a long period.
Now it’s time to look at the other extreme (the good one, that is).
The passive investor’s performance
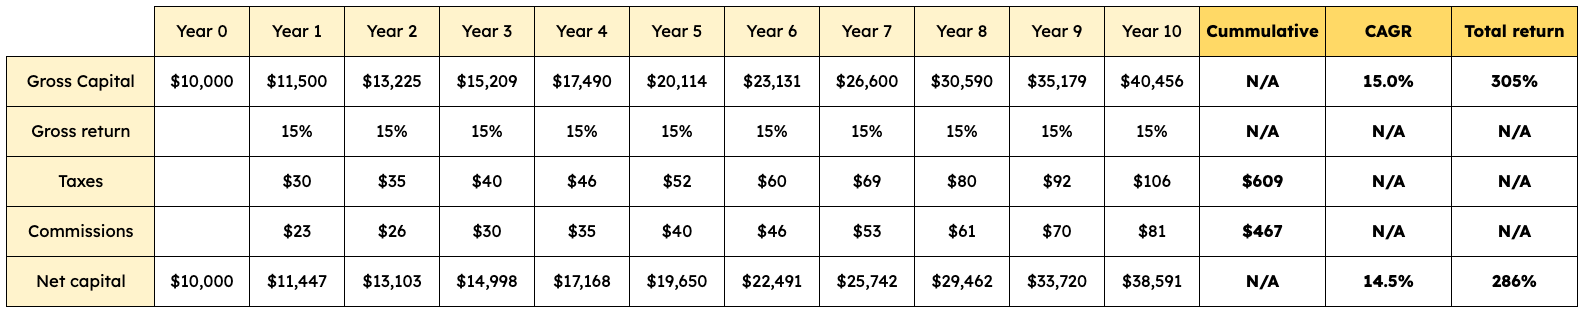
At the other extreme (from the frequent trader), we have the passive investor, who only sells 10% of its unrealized gains yearly and incurs low commission expenses (due to less frequent trading). Similarly to the other cases, this investor starts with $10k and compounds at a 15% CAGR. By the end of the period, he has cumulatively paid the following hidden expenses…
$609 in taxes
$467 in commissions
This leads to total hidden costs of $1,076. Like in the other two cases, this is not the only cost for the investor as this is money that they can’t reinvest at a 15% CAGR; however, as they incur much less hidden costs, the “compounding machine” is not as “disrupted” as in the other cases. The passive investor’s portfolio ends with a net value of $38,591 (compared to the gross value of $40,456). This investor also faced hidden and opportunity costs but to a much lesser extent than the others. His net CAGR would be 14.5%, for a total return of 286% (compared to the gross figure of 15% and 305%, respectively).
If we compare the three scenarios side by side, we can graphically see how significantly these costs can add up over the long term. As I’ve repeated several times throughout the article, the difference not only comes from the hidden costs but also from opportunity costs of not having this money available to reinvest at good returns:
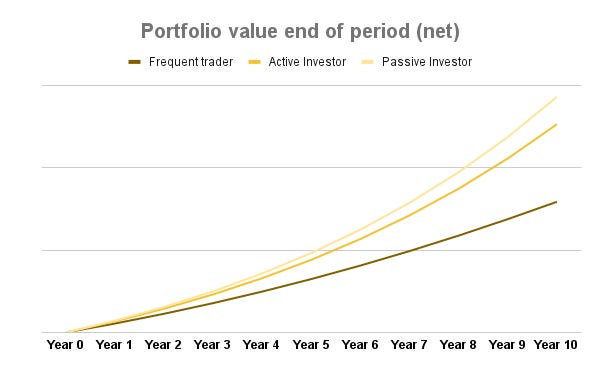
Of course, you probably know how compounding works: the more we lengthen the investment horizon, the more substantial the difference between the different strategies becomes.
Despite these results, the “funny” thing is that individual investors sharing their results online will fail to account for taxes (commissions are indeed paid through the broker), meaning that the reported results will likely be overestimated for active traders. With this in mind, I thought looking for the equilibrium CAGR would also be a good idea. The equilibrium CAGR is the gross return that a frequent trader would need to achieve to match a perfect buy-and-hold investor (i.e., the gross return).
The equilibrium CAGR
As frequent traders incur significant costs that detract from their LT net returns, it goes without saying that they should achieve a significantly higher gross return to compensate for such costs, but what does “significantly higher” mean? This is where the equilibrium CAGR comes in.
For a frequent trader to achieve similar total returns as a perfect buy-and-hold investor (no taxes or commissions paid throughout the 10 years), they would need to generate a whopping 23% CAGR during the period. This would lead to total net returns of 317%, which is similar to the gross return of 305% (the gross return is analogous to a buy-and-hold’s return):
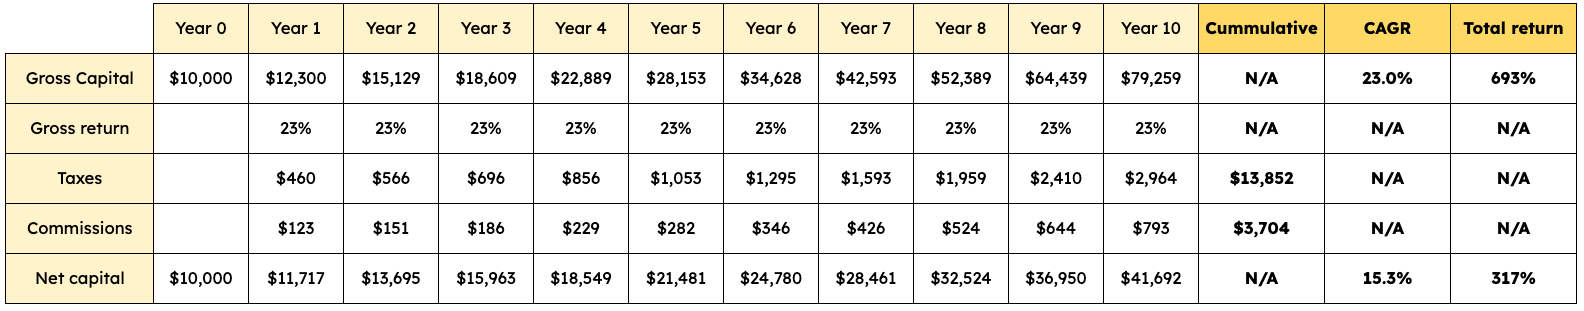
Should an investor generate the same equilibrium CAGR of 23% over a decade without incurring commissions and taxes, their total return would be close to 700%! This should teach us two things…
Commissions and taxes play an outsized role in long-term compounding, even if they are “hidden”
Gross returns should not be compared against each other because how one achieves such returns also matters dearly
With this said, let’s briefly talk about what you should and should not take away from this article.
What you shouldn’t take away from this study and what you should
I’ve already discussed at length what one should take from this article: commissions and taxes are real expenses that can become very significant over the long term. Even though these costs are hidden in our brokerage statements, we should be very aware of them.
What you shouldn’t take from this article is that you should never sell to minimize these costs. When the thesis of a company has been impaired, or its prospects are not rosy, one should sell without caring much about these expenses. However, building a portfolio of companies that one would (supposedly) hold forever pays off, as these types of companies are likely to minimize transaction costs. Any company should be bought with the intention of holding it forever (although it won’t turn like this in many cases), and there are two things of utmost importance so we can achieve this. The company must have…
A durable competitive advantage
A long reinvestment runway
Only through these two characteristics will a company be able to compound capital for us in a transaction-efficient manner. The beauty of investing is getting a company to compound capital for you. In such a case, the investor wins, not the broker or the government (which will obviously take its fair share in the end, but you’ll not suffer the opportunity cost of having less money to reinvest every year).
Taxes should, however, be an important consideration when selling for valuation reasons. People often sell a company when it’s slightly overvalued without considering taxes, leading to unfavorable long-term outcomes. Let’s see it with a quick example.
Imagine holding a company I bought for $100 with a 40% unrealized gain. This means that the company currently trades for $140. Its fair value is $110 (or around 20% less than what it trades for). Should I sell this company to reinvest the proceeds elsewhere, I should be aware that the amount I’d have to reinvest is not really $140 but $132 (as I would’ve paid $8 in capital gains taxes, assuming a 20% capital gains tax rate). To get back to $140 (my pre-tax investment), I would need to find an investment that’s undervalued by at least 6%.
Conclusion
I sincerely hope this article helped you understand how some “hidden” costs can hinder your long-term returns and why you shouldn’t over-obsess when comparing gross returns. It’s not only the returns per se that matter but…
The risk we assumed to achieve them
The hidden costs we incurred along the way
This article focused on the second because the first topic is inherently much more subjective, but who knows if I might write about this in the future too.
In the meantime, keep growing!
I agree with the article. However, when comparing the net returns at the end of year 10 do you recognise that the unrealised gain on the passive portfolio is much larger which results in a large tax impost when realised at the end of the period? When you cash out the portfolios the passive investor is still better off because they have deferred tax, but the tax will be paid eventually (unless you never sell)
You're right. I spend most of every day thinking about investing, and I'd never stopped to work out how much more I'd actually have to achieve gross to get the same net return - the 23% gross for 15% net with a 100% turnover surprised me.