

Constellation's Q3: Swimming Against The Current

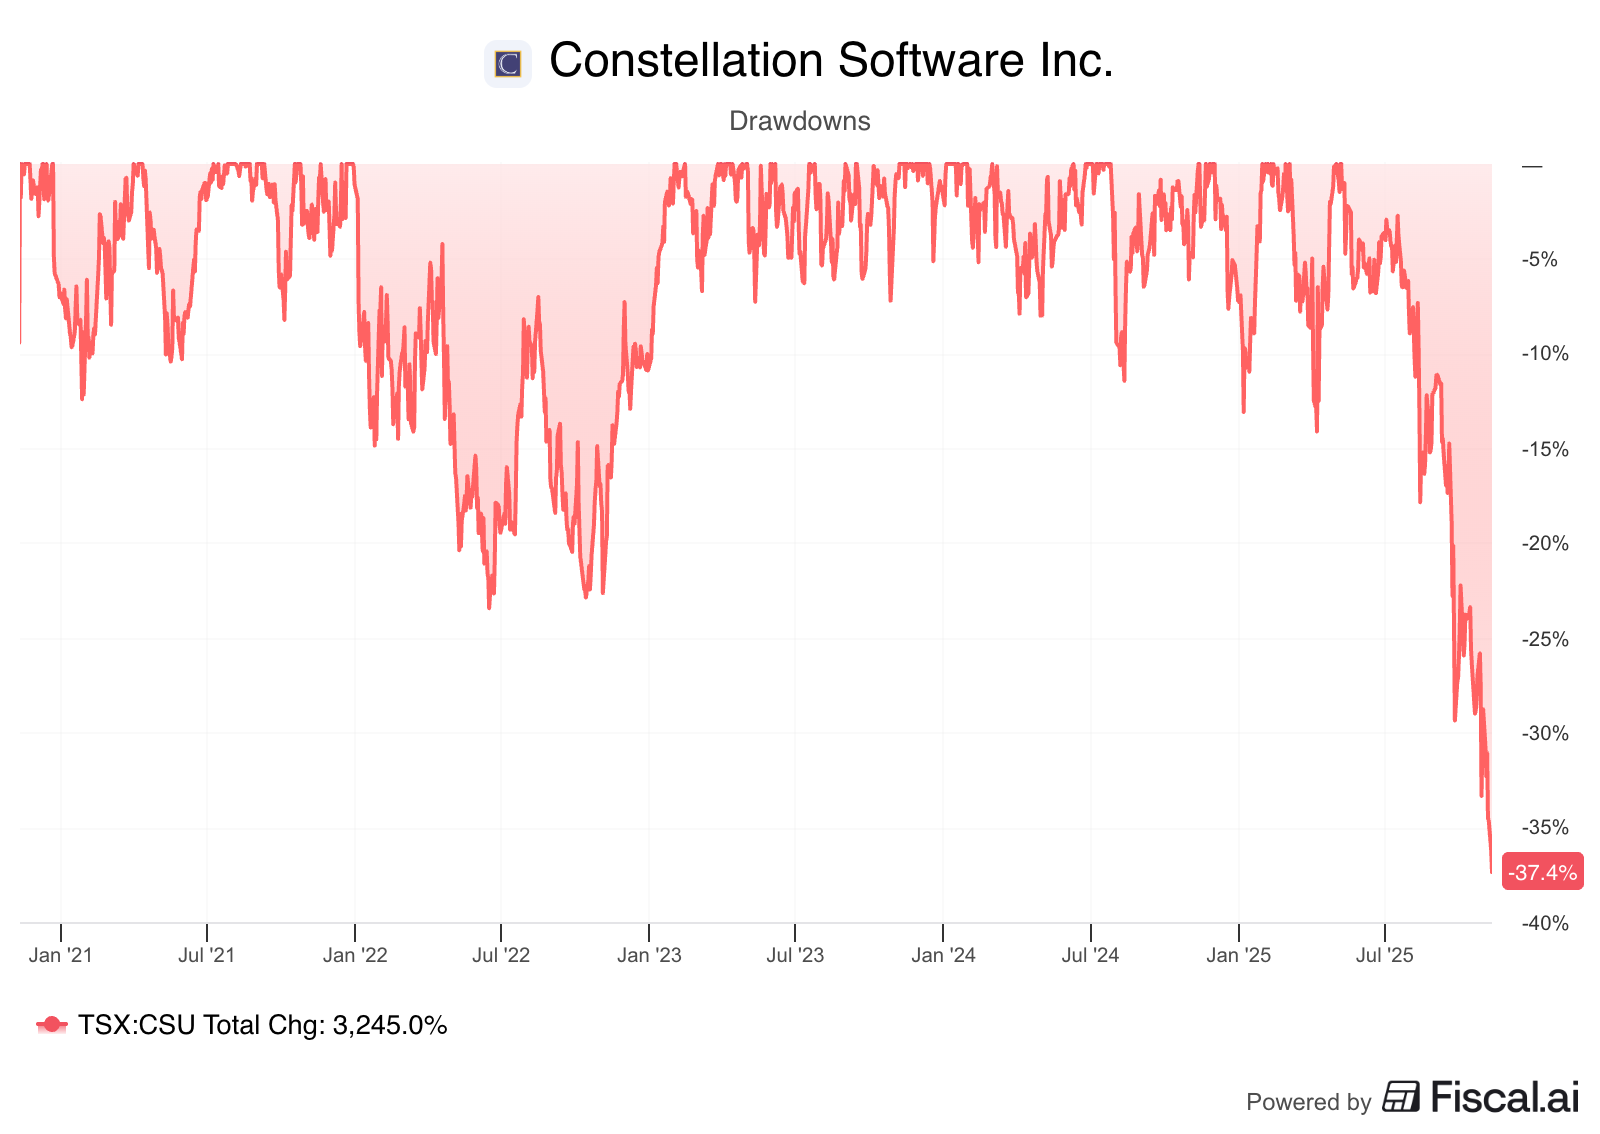
Constellation Software and Topicus reported earnings last week. If you follow both companies closely, you might have realized that their stocks have not been performing well lately. This is an understatement considering that Constellation is currently in its most significant drawdown in history (almost 40% off ATHs):
Even though pinpointing the exact reason for the drop is impossible (Constellation has suffered several “headwinds” simultaneously), I would say that we could attribute it to the coexistence of two things:
The reigning narrative that AI will render Constellation’s products obsolete (I explained why I don’t think this will be the case in a recent article)
The fact that many investors probably owned companies within the Constellation universe because “they always go up!”
(One could also attribute it to Mark Leonard’s departure, but this would not fully explain Topicus’ drawdown)
Even though I can’t prove the second point, there’s no denying that stocks that exhibit such linearity over time don’t lend themselves to having shareholder bases with high conviction (for obvious reasons: no work is apparently required to make money on the stock because it always goes up). I would say this is also going to test Constellation’s model, as managers have never felt the pressure of having to deploy increasing amounts of capital during such a significant drawdown, and employees are likely seeing their bonus money decrease significantly.
I have decided to divide this article into several sections:
The numbers
Capital deployment
The AI narrative and a potential leading indicator
Valuation and the inflection
Note that one of the complex things about both Constellation and Topicus is that their accounting is not as straightforward as it may seem. This leads many people to focus on incorrect numbers and, therefore, jump to inaccurate conclusions.
Without further ado, let’s get on with it.
a. The numbers: similar to last quarter
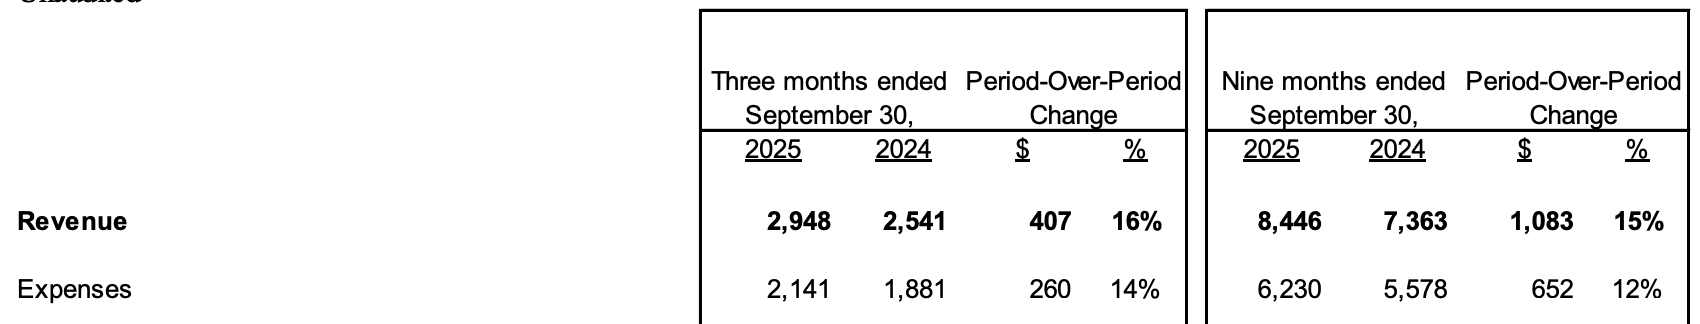
Constellation reported solid numbers in Q3. Its quarterly revenue growth rate accelerated to 16% YoY (from 15% last quarter), and operating margins expanded once again. Constellation has enjoyed significant margin expansion over the first 9 months of the year, with revenue growing 300 bps ahead of expenses:
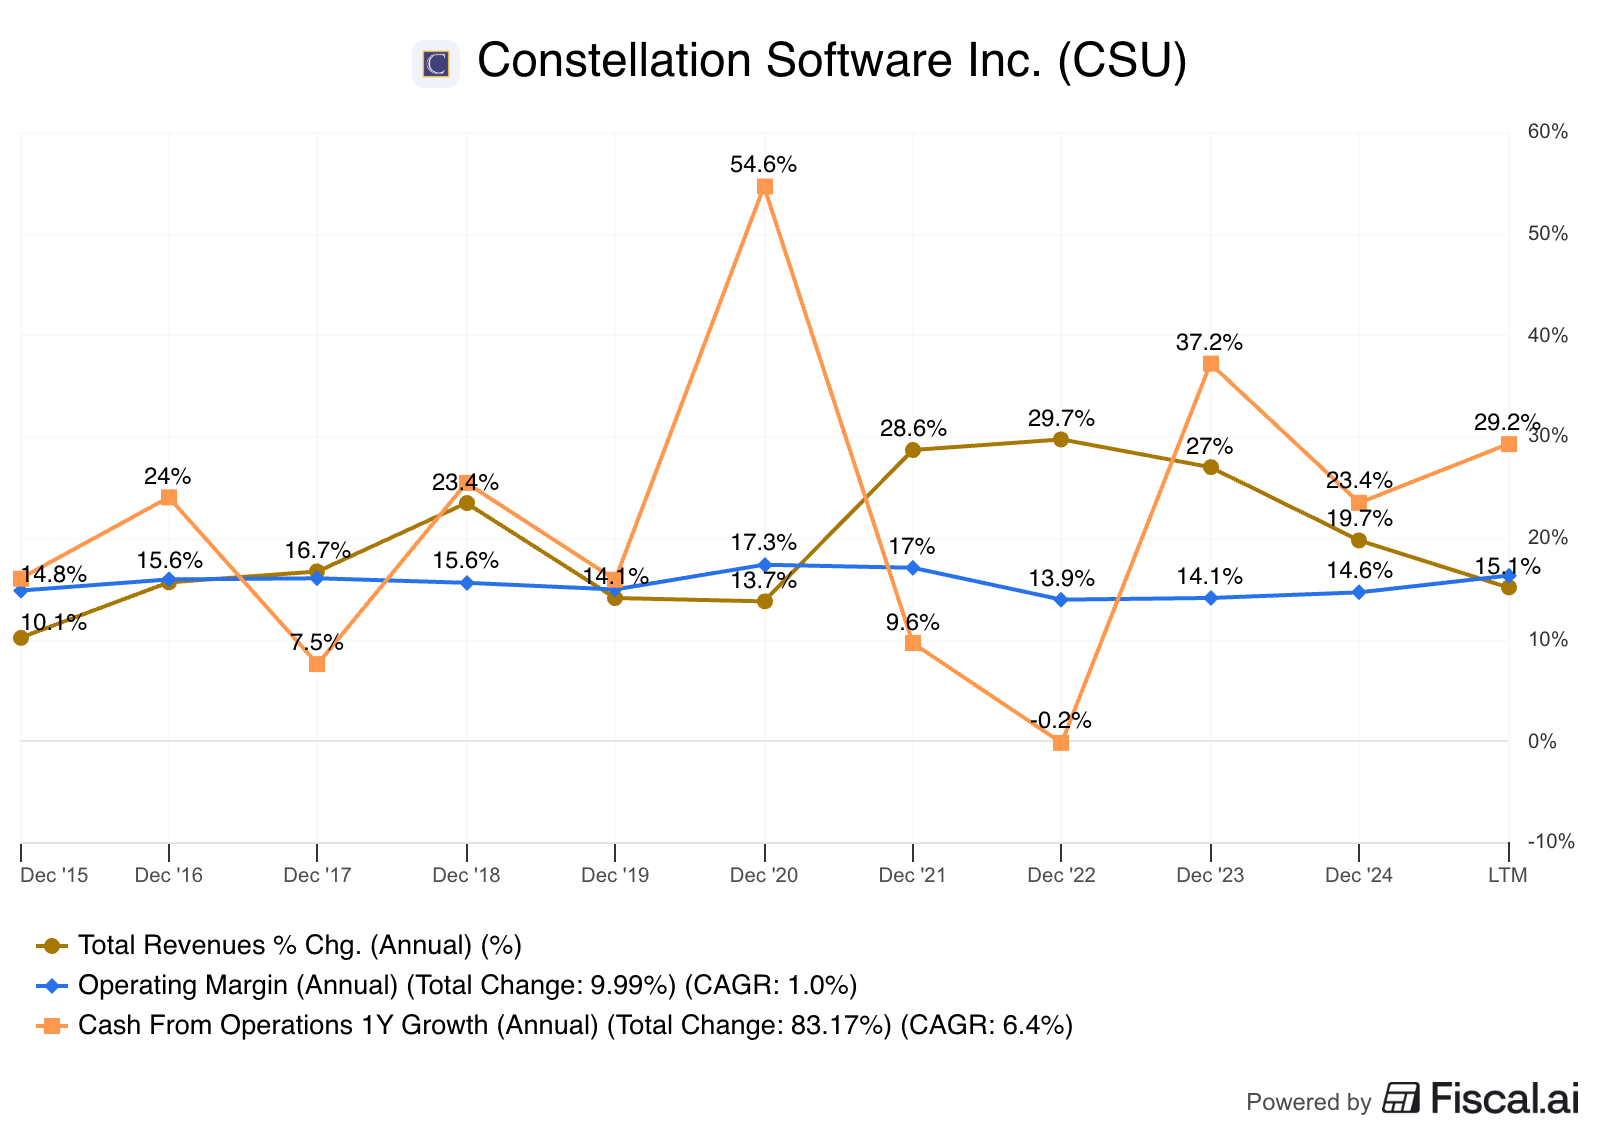
There’s evidently a counterbalance to this margin performance: capital deployment has slowed somewhat (though it has picked up recently). When capital deployment slows, margins expand because the company becomes more efficient (both in terms of opex and cash conversion). Take a look at the following graph (courtesy of Finchat). When revenue growth slows due to a slower period of capital deployment, margins and operating cash flow improve:
I would always take the higher capital deployment at Constellation’s IRR over the higher margins, but it’s worth thinking about one thing: Constellation’s steady-state margins are likely significantly higher than current numbers suggest (of course, growth would also be much slower in this scenario, closer to organic).
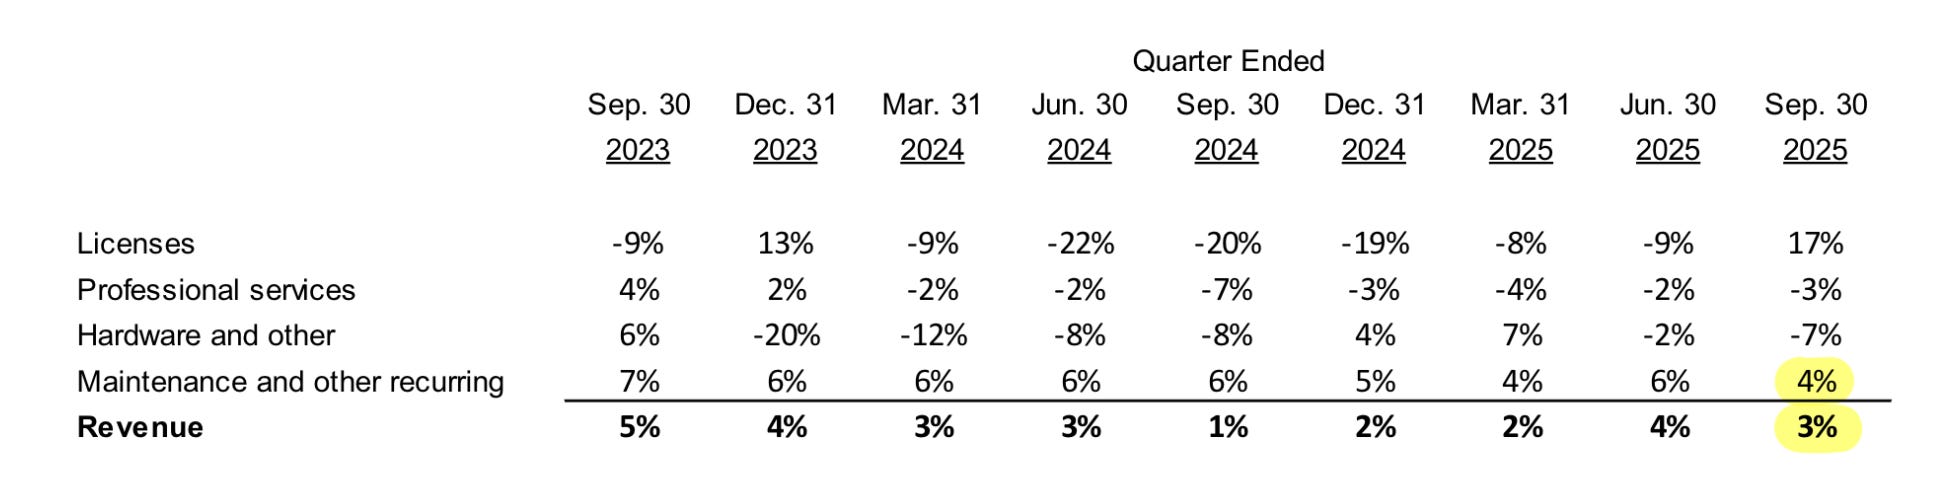
Organic growth was again acceptable, with Maintenance and Other recurring (FX-adjusted) (‘M&R’) growing at 4% and overall organic growth of 3%:
There were several moving parts in organic growth. As usual, Topicus was a tailwind to these numbers (+6% in M&R organic growth), and Altera was a headwind (-10% in M&R organic growth). The weakness that Altera is exhibiting should not be surprising, considering that Jeff Bender openly discussed this during the AGM and mentioned that it had been taken into account at the time of acquisition:
So I think this year, for sure, Altera is -- will have a negative organic growth due to attrition that sort of was known at the time of the acquisition. We have a pretty detailed schedule of customers who have already made a decision and they’re in the process of moving to a different solution. So I think we have good visibility as to what’s happening there. Altera is a big business. There are a lot of customers who had made previous decisions to move to a different solution. So I think the strain on or the downward pressure on organic growth is significant. So I think it’s significant in Altera as a business unit. It also has a large impact on the Harris overall results in terms of Harris’ overall organic growth as well, reducing it substantially.
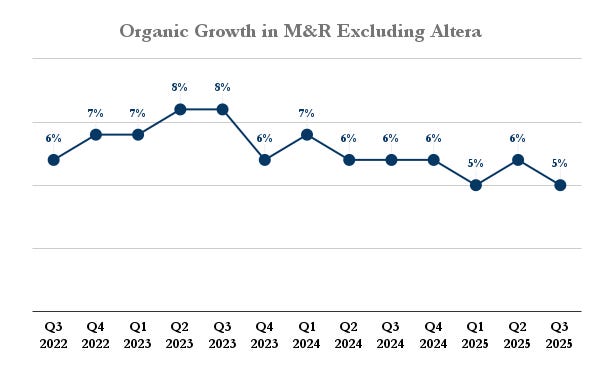
This should alleviate some “AI will considerably increase churn” concerns, because the “pressure” on Constellation’s organic growth has come primarily from Altera, not a widespread trend of AI eating CSU’s lunch. In fact, we can see this somewhat when we plot Constellation’s maintenance and organic growth rates excluding the impact of Altera (note that these are not FX-adjusted). Despite now facing post-pandemic inflation headwinds (i.e., tough comps), M&R organic growth has remained relatively stable (albeit it has probably enjoyed some FX tailwinds). And all despite the ongoing AI narrative:
Note that Constellation doesn’t acquire companies that grow fast or that it expects to grow fast, but businesses in which it hopes to achieve an adequate cash IRR. Despite Altera’s recent negative performance, the subsidiary was once again cash flow positive. Constellation has generated $311 million in FCFA2S from Altera since Q2 2022 after paying $700 million for the asset (Constellation used around 50% debt to finance the purchase, so they have pretty much recovered their cash investment). Over the first 9 months of 2025, Altera’s revenue was “only” 10% lower than revenue over the first 9 months of 2023, so it’s not like Constellation has totally “milked” the business. Operating profit through the period, however, has grown 47%.
The only thing I believe is worth noting from the rest of the P&L is a new line that appeared on both Topicus’ and Constellation’s expenses: Revaluation of investment accounted for using the equity method to cost:
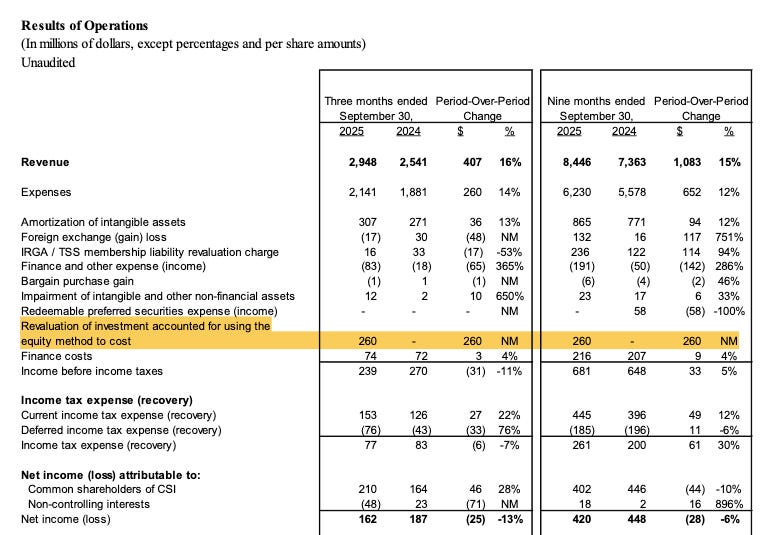
Topicus has changed the accounting treatment of its Asseco investment from the equity method to the cost method. The company had enjoyed several revaluations of the investment that positively impacted the P&L, and has now reversed them as an expense. It has absolutely no impact on cash earnings (just like the IRGA liability revaluation charge), but it makes the P/E more misleading than it already is.
By the way, with both stocks dropping considerably, I’ve seen an increasing number of people citing their P/E ratios (with this accounting change, Topicus trades at a P/E of 1,000 according to Google Finance). This is probably a sign of the times/sentiment. Another thing I’ve also seen is people comparing Constellation’s and Topicus’ numbers to Street estimates. I’ve been following both businesses for years, and it’s the first time I’ve seen this, which is interesting. Note that if the business model has one characteristic, it is that it’s completely unforecastable, as capital deployment plays an outsized role in the numbers and it’s inherently lumpy.
The highlight (as it most always is for Constellation) could be found in the cash flows. I am not particularly fond of subtracting the IRGA liability revaluation charges to arrive at the FCFA2S number (for reasons I explained in last quarter’s article), so I’ll add them back. Constellation’s Operating Cash Flow has grown 28% over the first 9 months, and FCFA2S, excluding the IRGA liability, has grown from $1.11 billion to $1.495 billion, a whopping +34%! (Note that the IRGA liability belongs exclusively to CSU, so no need to adjust the NCI when adding it back):
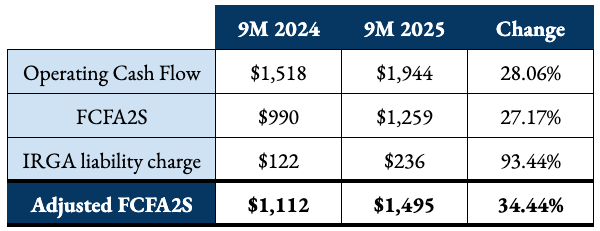
For the reasons I discussed above, it’s not unusual to see Free Cash Flow perform strongly in periods of slower capital deployment. This, honestly, makes the model very appealing and countercyclical in and of itself.
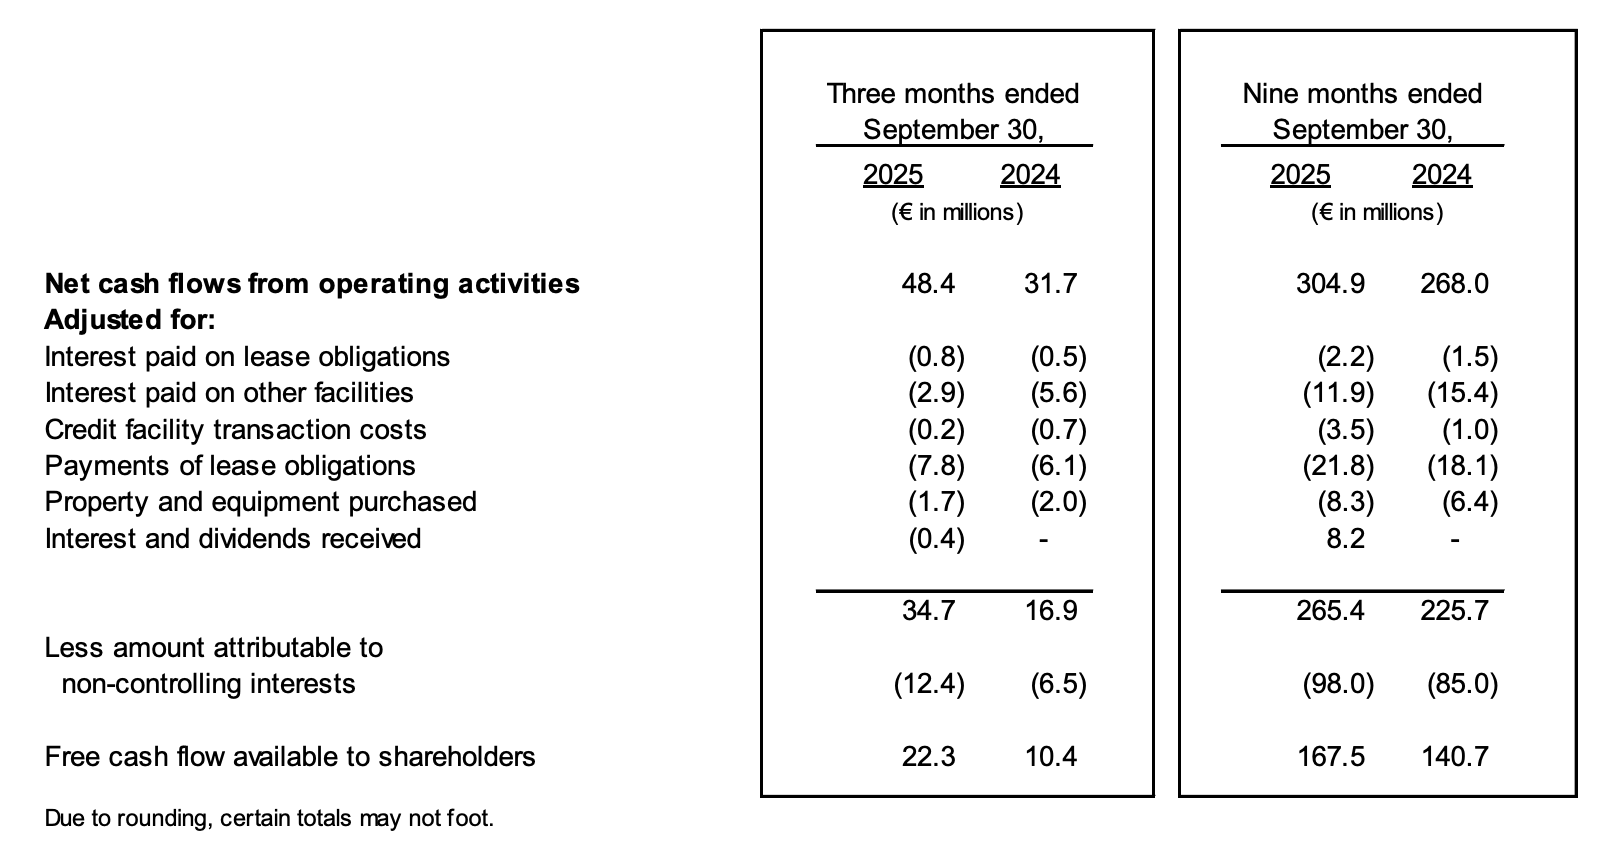
The cash flow development at Topicus was also good, with OCF growing 14% over the first 9 months and FCA2S growing 19%. Note that Topicus has deployed considerably more capital than Constellation lately (more on this later):
All in all, pretty good headline numbers for both Constellation and Topicus despite the persistent noise.
b. Capital deployment
As you might have inferred from the organic growth numbers, capital deployment is a pretty relevant topic for Constellation and Topicus. The model is based on their ability to reinvest 100% of their Free Cash Flow into VMS acquisitions at high IRRs. The model, in and of itself, is challenging because achieving high IRRs becomes harder as one scales. This week, my friend MBI shared a ROIC calculation showing that Constellation’s ROIC has indeed decreased (from around 30% to 17%) as it has scaled. 17% remains (in my view) a level that justifies total reinvestment of cash flows, but is Constellation still finding opportunities at said IRRs? Let’s take a look.
Constellation has generated approximately $1.5 billion in FCFA2S over the first 9 months of the year, excluding the IRGA liability. It has spent $855 million on acquisitions year to date, but this number needs to be adjusted for…
The purchase of Asseco: $289 million in Q4
The capital deployed so far in Q4: $454 million
This means that Constellation has deployed $1.6 billion in capital so far this year, with two months to go in Q4. The problem with directly comparing FCFA2S to capital deployed is that we shouldn’t. The reason is that FCFA2S excludes NCI (Non-Controlling Interests), whereas capital deployed is a consolidated number (if I’m not wrong). Comparing both as if they were apples to apples would benefit Constellation’s reinvestment numbers. There are two “solutions” to this problem:
Comparing FCF before NCI and excluding the IRGA liability to total capital deployed: this should theoretically give us Constellation Software’s universe (Topicus, Lumine…) reinvestment number, or something close to it
Compare FCFA2S to the capital deployed by Constellation itself (a trickier exercise) to find out Constellation’s reinvestment rate
So, let’s start with the first solution (the easy calc). FCF before NCI, excluding IRGA, for the first 9 months was $1.67 billion. The “universe” has deployed around $1.6 billion in capital thus far this year (up until November), so we could infer that the reinvestment rate this year will be close to 100%. Now, I can tell you that Constellation itself is likely trending below this number before I make my calcs, because I am well aware that Topicus is trending significantly above 100% (which led me to start a position a few weeks ago).
Topicus has generated $265 million in FCFA2S (before NCI to simplify things) and has deployed a whopping $577 million into acquisitions thus far this year (including Asseco)! This means that Topicus’ reinvestment rate is likely to land significantly above 100% this year (potentially above 200%). Let’s make some quick calcs to understand what Constellation’s reinvestment rate may be (I’ll only adjust for Topicus).
Out of the $1.6 billion in capital that the Constellation universe has deployed thus far this year, $577 million has been deployed by Topicus. Constellation owns around 31% of Topicus on a fully diluted basis, which means that around $180 million of the $577 million deployed by Topicus ultimately belongs to Constellation, or what’s the same, that $397 million does not. This means that Constellation itself has deployed around $1.2 billion into acquisitions, which we should compare against FCFA2S (post NCI and excluding the IRGA) of $1.5 billion. Constellation’s reinvestment rate thus far this year has been around 80%. The caveat here is that there are still 2 months to go and one additional quarter of FCFA2S, so it may vary.
I hope I haven’t lost you in my calculations, and if you’ve seen a mistake, please let me know. What I wanted to convey in this section is that, overall, both businesses seem to be still reinvesting significant amounts of cash in acquisitions despite fears of a slowdown. Note that capital allocation (when one focuses on IRRs and not on “acquisitions at all costs”) is inherently lumpy. I remember, as if it were yesterday, when Topicus was criticized for not deploying enough cash into acquisitions and for paying a special dividend (which happened around a year ago). I think these skeptics have been ultimately proven wrong.
c. The AI narrative and a potential leading indicator
I am not going to go over all the AI narrative again, as I imagine most of you are already familiar with it and I’ve discussed it in other articles: AI promises to render software obsolete because everyone will vibe-code their own VMS solution (because it’s so cheap now!).
I believe some people are mistaking this bear case as a short- to medium-term threat when, in reality, it’s a long-term threat (at least the narrative is). I don’t think the market is worried about AI negatively impacting CSU over the next 2-3 years, but rather about what it could do to the terminal value of the businesses Constellation has acquired over the years. This means we shouldn’t really look at current organic growth numbers to determine whether Constellation is being impacted; we should focus on what AI means for the terminal value.
At first, I thought that a good leading indicator might be a metric related to impairments. In theory, impairments happen when Constellation/auditor deems that the future cash flows of a business have been impaired. This said, a good friend and great investor rightly pointed out that Constellation is unlikely to be very generous with its revenue and FCF growth rates when it acquires a business (meaning there’s not much value assigned to its terminal value), and that this metric might therefore not be helpful. I kind of agree with him, but I had already calculated it, so here it is.
Note that we can’t look at the absolute number because Constellation’s invested capital base keeps growing. This means that a $10 million impairment in 2005 is significantly more material than the same impairment in 2024. For this reason, I have decided to divide the impairments against the company’s asset base subject to impairment, calculated as goodwill + intangibles - accumulated amortization (assets that have already been amortized are not tested for impairment). I then divide the impairment figure by the average asset base for that year to get to my numbers. As my friend rightly pointed out, there’s no clear trend in the numbers. The metric was 0% until 2019 and then…
2020: 0.35%
2021: 0.26%
2022: 0.11%
2023: 0.29%
2024: 0.25%
We still don’t have the actual numbers for 2025, but it’s tracking below 2024. These, by the way, only consider impairments. Should we consider contingent considerations (the amounts CSU has to pay when acquisitions perform better than expected) as a counterpart, then the numbers would be even lower.
d. Valuation and the inflection
As I’ve discussed at the beginning of the article, Constellation’s valuation has come down significantly, not only because the multiple has contracted but also because Constellation has continued to grow at a good pace. Let’s take a look at some numbers.