

Confirmed data center + inflection play
Texas Instruments’ Q1

Texas Instruments delivered an outstanding quarter last week. One doesn’t have to look much further than what the company delivered against expectations…
Revenue of $4.83 billion (up 19% YoY) beat analyst expectations by $300 million (7% beat)
EPS of $1.68 beat analyst expectations by $0.32 (24% beat)
Even though these beats are outstanding in their own right, it would not be the first time that Texas Instruments benefits from a pull forward which allows the company to take analysts off-guard. This is why the beats should be understood in the context of the outlook. There were also good news here.
Texas Instruments guided for Q2 revenue of $5.2 billion, $330 million ahead of consensus expectations. The EPS guide for Q2 of $1.91 also came significantly above the consensus of $1.57. The market reaction was one would expect after seeing these numbers: Texas Instruments’ stock rose almost 20% to fresh new ATHs and is now up more than 50% YTD:
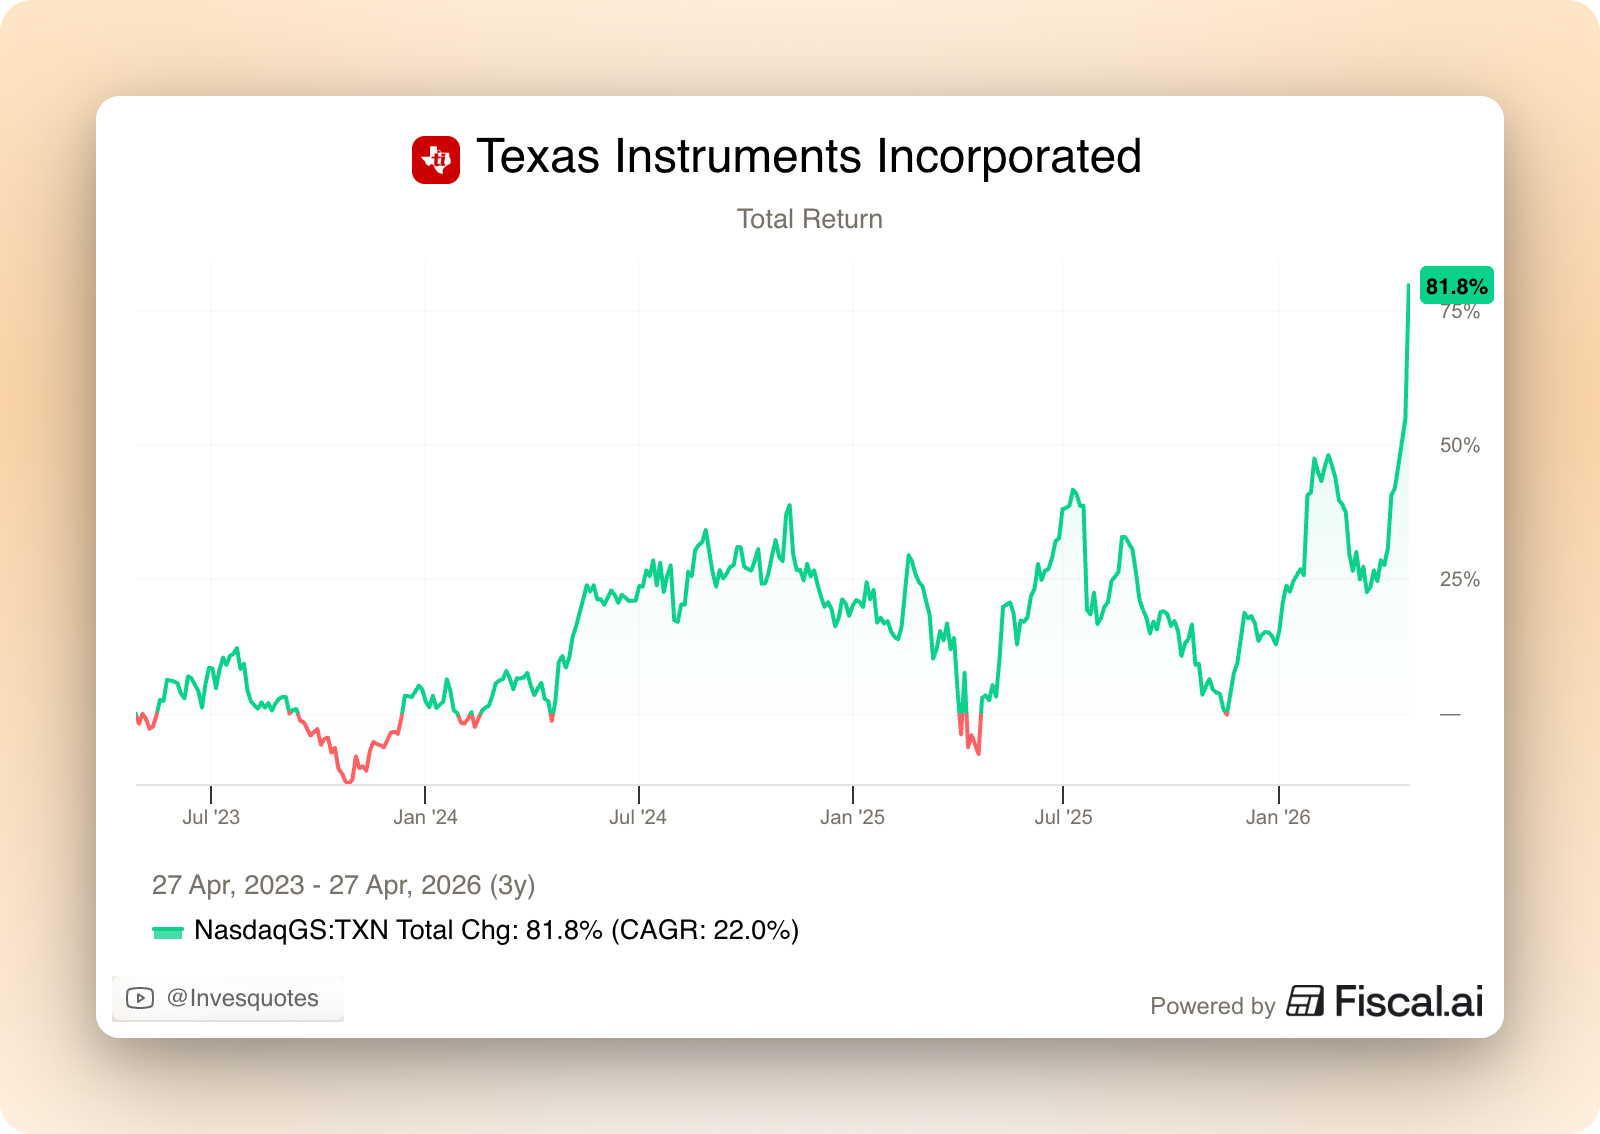
Texas Instruments is a great example of how the stock market rarely grants investors with linear returns. The past 5 years have been pretty rough for TI shareholders. The destocking took longer to play out than expected and, when it was over, many end markets were already in a downturn. This eventually translated into flat returns for the past 3 years or what Wall Street would coin “dead money.”
The recent run has changed things pretty significantly. The stock is now up 82% over the past 3 years, delivering a 22% CAGR (total return). Let’s take a look at my particular case. I started a position in TI on May 2022. This position had been flat for a pretty long time and was honestly quite exhausting because it was pretty volatile. After the recent run (and including dividends), the position has compounded at around a 15% CAGR. Patience was needed and the path was rocky, but the outcome was the one that was intended in the first place. Where am I going with all of this? Where the stock price has been in the past and what it’s doing in the current time says little about the CAGR one can realize in the future: stock returns are typically non-linear.
Texas Instruments is also a great example of how the investment world “lives off” opportunism (because it sounds very smart at the time). I remember that when the pull forward took TI’s management by surprise and led them to miss earnings (barely a couple of Qs ago), many (opportunisitically) claimed that management had run shareholders over a cliff and that TI “had lost the plot.”
While this might or might not have been true, TI acknowledged their lack of visibility due to their short lead times. The outcome that investors should’ve cared about (even though being an opportunist sounds smart) was that the timing was irrelevant for long-term investors (pretty evident at the time). These people, however, did not miss the opportunity to sound smart (aided by the stock price). Unsurprisingly, one can’t find these same people discussing TI’s earnings today (maybe has to do with the stock price, shocker).
This doesn’t mean that they’ll not return. Management acknowledged again their lack of visibility but mentioned that they had embedded conservativeness in the Q2 guide (which is astonishing considering the magnitude of the beats):
We see the buildup of demand as we go, almost real time. I want to see, let’s let Q2 play out and see if this growth is sustainable.
They also alluded to holding their pricing expectations (LSD to MSD decline) unchanged but that the year is constructive of better pricing (another upside lever).
The goal of the article is to briefly go over the earnings and to discuss the valuation. In the last update on TI, I concluded with the following:
If I weight these returns according to my probabilities, I get to an expected stock price return for Texas Instruments (assuming that my base case is the low end of the 2026 scenarios of $7 in FCF/share and a 25 exit multiple) of 0%. Evidently this isn’t great, but let’s not forget that at open today the stock will already be up 19% and that there are sources of upside to these numbers (i.e., underlying FCF may well be above $7 per share in 2026), which is dependent on how the cycle unfolds.
I’ll continue to hold my shares but I don’t expect to add at these prices.
With the shares today trading around 30% higher, it begs the question:
Are TI’s shares still attractive today?
I believe the answer to this question is not as direct as it seems, and I’ll aim to explain why in the second section of the article. Now, one thing that I wanted to discuss before jumping into the article is the relative attractiveness of cyclical (but secular) companies for long-term investors. I believe that, in the short-term oriented world that we currently live in, these business can provide pretty appealing opportunities to the patient investor.
For these kind of businesses, investors tend to forget (mostly during downcycles) that operating leverage cuts both ways. When numbers are dropping everyone (including Wall Street analysts) is likely to focus on reported numbers and forget that things can improve relatively quickly once the cycle turns. Many wait until the inflection is already here, but by then, the market has already realized that profits also use the elevator to go up. Texas Instruments is also a good example of this, let’s see why.
Texas Instruments’ quarter
I believe TI’s summary table clearly portrays how good the quarter was:
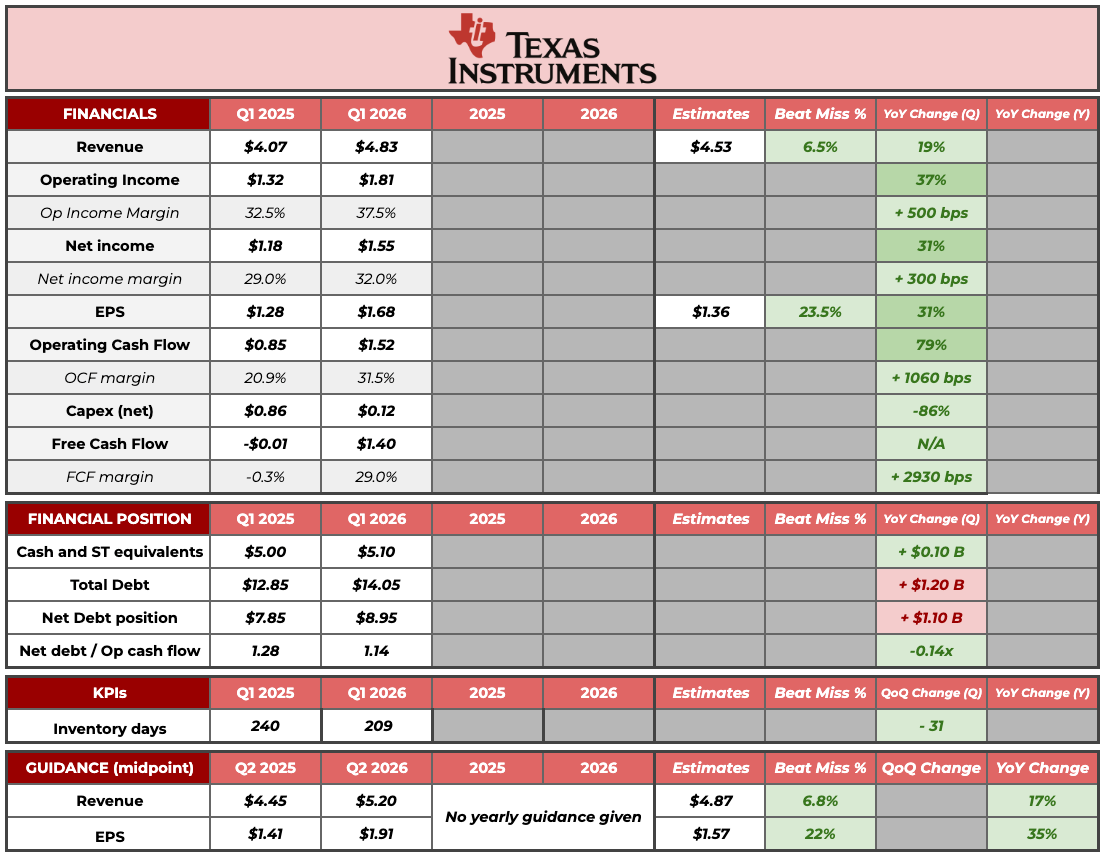
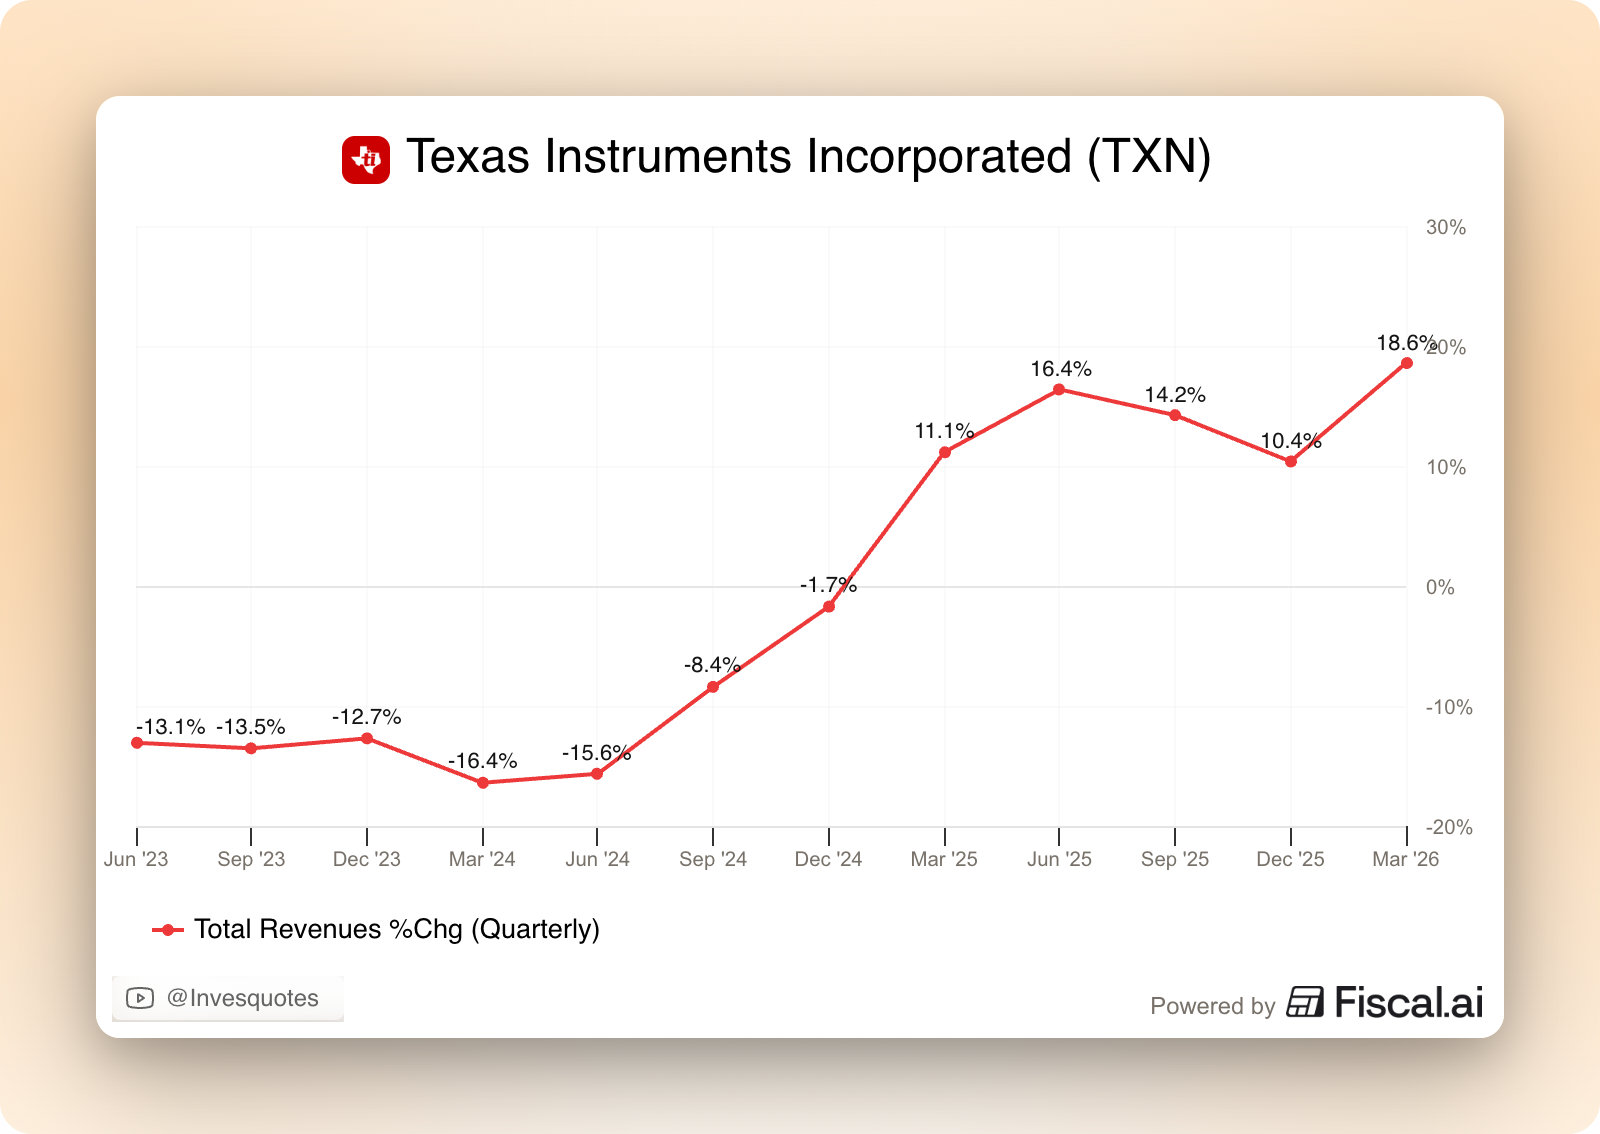
The first thing that jumps out from the table is that growth is back in full force, which seems to indicate that the cycle has improved materially. TI reported yet another double-digit growth quarter after an encouraging few quarters of double digit growth, but this one was the first that suffered significantly tougher comps (as TI was already growing DDs in Q1 2025):
Management argued that the strength was driven by industrial (+30% YoY) and data center (+90% YoY). They gave several interesting details around these two end markets. On industrial (which recall is the company’s largest end market), management mentioned that (despite the ongoing strength) the company remains 15% below the 2022 peak. If you believe (like I do) that this is a secular market, one would think that the 2026-2027 peak should be around 30%-40% higher than where the company currently stands (the 15% below peak + the secular growth on top). This ultimately means that, despite the recovery, there’s still a long way to go.
On data center, management explained why they believe they have a right to win:
We can fulfill, I would say, almost every analog socket on these racks. I think we are very unique in that point, not only because of the breadth of the portfolio, also because our ability to supply.
This great growth evidently resulted in considerable operating leverage. For the past two years, I’ve discussed numerous times that TI is a fixed-cost business. This ultimately means that when revenues drop, margins drop significantly, and therefore profits drop considerably more than revenue. I also claimed that the good news was that operating leverage cuts both ways, and this is what we are (positively) experiencing now: operating profits rose 37% on a 19% YoY revenue increase. It seems like operating leverage will continue next quarter: management expects a 35% operating profit increase on a 17% revenue increase.
This profitability improvements are being further amplified on the company’s cash flow statements through lower Capex (as the capacity buildout gets to an end) and unwinding inventory. Recall that both of these things were discretionary hits to cash conversion. Management decided to undertake a massive capex cycle during the downturn due to the belief that its markets are secular and also aided by the fact that the US government was “kind enough” to pay for part of this expansion plan. This expansion phase is now ending, and therefore Free Cash Flow is naturally improving.
The other sleeve of the strategy is inventory. TI ran through the downcycle with an elevated inventory level, for two reasons:
The company’s inventory has a low obsolescence risk (i.e., they can carry significant inventory)
Management trusted the secular nature of its markets and believed it would allow them to gain share once the market turned
The second thing is already happening: inventory days were down sequentially following the market’s shift and allowed TI to gain share from more capacity-constrained competitors.
Our supply, our availability is allowing us to win back market share.
Inventory days coming down means better cash flows, which seems pretty evident in the numbers: operating cash flow rose almost 80% this quarter. If there was one misleading metric for TI throughout this entire downcycle, that was Free Cash Flow (and I hope it’s clear why).
These better FCF trends can have potential implications for the 2026 targets set by management during the Capital Management Update. Management believes that, at current growth rates, $8 in FCF per share is probably a tad conservative…
As long as revenue is growing mid to high single digits, that $8 free cash flow per share is very probable, highly probable. Now, as I said before, first half of the year at the midpoint is somewhere between 15%-20% growth right? There’s definitely an upside. Right now, assuming we don’t have a false start, I think there is a very high, very likely we will easily beat that $8 free cash flow per share for 2026.
So, what does this imply for the valuation? Let’s take a look.